Ratio, Proportion and Rate
Ratio, Proportion and Rate
Key Concepts
-
Ratio
- A ratio compares two quantities of the same kind.
- It shows how much of one quantity there is compared to another.
- Ratios can be written in 3 ways:
a : ba/b- “a to b”
- Example: If there are 2 boys and 3 girls, the ratio of boys to girls is 2 : 3.
-
Equivalent ratios
- Two ratios are equivalent if they represent the same comparison.
- Example:
2 : 3 = 4 : 6 = 6 : 9 - You get equivalent ratios by multiplying or dividing both parts by the same number.
-
Proportion
- Proportion means two ratios are equal.
- Example:
2/3 = 4/6 - In proportion questions, you often find a missing value by using the fact that the ratios are equal.
-
Direct proportion
- Two quantities are in direct proportion if:
- when one quantity increases, the other also increases in the same ratio
- when one quantity decreases, the other also decreases in the same ratio
- If
yis directly proportional tox, we write:y ∝ xy = kx
- Here,
kis a constant of proportionality. - Example:
- Cost is directly proportional to number of items if each item has the same price.
- If 1 notebook costs $2, then 3 notebooks cost $6.
- Two quantities are in direct proportion if:
-
How to recognise direct proportion
- The ratio
y/xis constant. - This constant value is
k. - Example:
- If
y = 3x, theny/x = 3for all values ofx.
- If
- The ratio
-
Graph of direct proportion
- A graph of direct proportion is a straight line passing through the origin
(0,0). - The equation is
y = kx. - The steeper the line, the larger the value of
k.
- A graph of direct proportion is a straight line passing through the origin
-
Inverse proportion
- Two quantities are in inverse proportion if:
- when one quantity increases, the other decreases
- their product stays constant
- If
yis inversely proportional tox, we write:y ∝ 1/xy = k/x
- Here,
kis also a constant of proportionality. - Example:
- Time taken to finish a job is inversely proportional to the number of workers, if all workers work at the same rate.
- Two quantities are in inverse proportion if:
-
How to recognise inverse proportion
- The product
xyis constant. - This constant value is
k. - Example:
- If
y = 12/x, thenxy = 12.
- If
- The product
-
Graph of inverse proportion
- A graph of inverse proportion is a curve, not a straight line.
- It gets closer and closer to the axes but does not touch them.
- If both
xandyare positive, the curve lies in the first quadrant. - The equation is
y = k/x.
-
Rate
- A rate compares two quantities measured in different units.
- Example:
- 60 km/h
- 80 beats per minute
- $5 per kg
- The word “per” usually means division.
-
Speed
- Speed is a type of rate.
- It tells you the distance travelled per unit time.
- Formula:
Speed = Distance / Time
- Rearranged formulas:
Distance = Speed × TimeTime = Distance / Speed
-
Units of speed
- Common units:
- m/s
- km/h
- cm/s
- You must make sure distance and time are in matching units.
- Example:
- km with h
- m with s
- Common units:
-
Map scale
- A map scale shows the relationship between a distance on a map and the actual distance on the ground.
- It helps us convert between map distance and real distance.
-
Types of map scale
- Statement scale: e.g.
1 cm represents 5 km - Ratio scale: e.g.
1 : 500 000 - A ratio scale means:
- 1 unit on the map represents 500 000 of the same units in real life
- e.g. 1 cm on map = 500 000 cm in reality
- Statement scale: e.g.
-
Distance scale
- Used to compare lengths.
- For example, if the scale is
1 : 100 000, then:- 1 cm on map = 100 000 cm actual
- 100 000 cm = 1 km
-
Area scale
- Area scale is different from distance scale.
- If the distance scale is
1 : n, then the area scale is1 : n². - Example:
- If length scale is
1 : 1000 - Area scale is
1 : 1 000 000
- If length scale is
- This is because area involves two dimensions: length × width.
-
Expressing relationships as equations
- Mathematical relationships can be written using equations.
- This helps describe how one quantity changes with another.
- Examples:
- Direct proportion:
y = kx - Inverse proportion:
y = k/x - Speed relationship:
d = st
- Direct proportion:
- To form an equation:
- Identify the variables.
- Decide whether the relationship is direct, inverse, or another rule.
- Use the given information to find constants.
- Write the final equation clearly.
Important Definitions
- Ratio: a comparison of two quantities of the same kind using division.
- Equivalent ratios: ratios that have the same value when simplified.
- Proportion: a statement that two ratios are equal.
- Direct proportion: a relationship in which two quantities change in the same ratio.
- Inverse proportion: a relationship in which one quantity increases while the other decreases so that their product remains constant.
- Constant of proportionality: a fixed number, usually written as
k, in proportional relationships. - Graph: a visual representation of the relationship between two variables on axes.
- Origin: the point
(0,0)on a graph where the x-axis and y-axis meet. - Rate: a comparison of two quantities with different units.
- Speed: the distance travelled per unit time.
- Map scale: the relationship between a distance on a map and the corresponding actual distance.
- Ratio scale: a map scale written in the form
1 : n. - Statement scale: a map scale written using words, such as
1 cm represents 2 km. - Distance scale: a scale used to compare lengths or distances.
- Area scale: a scale used to compare areas; it is the square of the distance scale.
- Equation: a mathematical statement showing that two expressions are equal.
- Variable: a symbol, such as
xory, that represents a quantity that can change.
Worked Examples
Example 1: Direct Proportion
3 packets of stickers cost $4.50. Find the cost of 8 packets, assuming cost is directly proportional to the number of packets.
Step 1: Identify the relationship
- Cost is directly proportional to number of packets.
- Let cost be
Cdollars and number of packets ben. - So,
C = kn
Step 2: Use the given information to find k
- When
n = 3,C = 4.50 - Substitute:
4.50 = k(3)k = 4.50 / 3 = 1.50
So the equation is:
C = 1.50n
Step 3: Find the cost of 8 packets
C = 1.50(8)C = 12.00
Answer:
- The cost of 8 packets is $12.00.
Example 2: Inverse Proportion
6 workers can complete a job in 15 days. How many days will 10 workers take, assuming all workers work at the same rate?
Step 1: Identify the relationship
- Number of workers and number of days are in inverse proportion.
- More workers means fewer days.
- Let number of workers be
wand number of days bed. - So,
d = k/w
Step 2: Use the constant product
- For inverse proportion:
wd = k
- Given:
6 × 15 = 90
- So
k = 90
Thus:
d = 90/w
Step 3: Find the number of days for 10 workers
d = 90/10d = 9
Answer:
- 10 workers will take 9 days.
Example 3: Map Scale and Speed
A map has scale 1 : 200 000. The distance between Town A and Town B on the map is 7.5 cm. A car travels from A to B at a speed of 60 km/h. How long does the journey take?
Step 1: Convert map distance to actual distance
- Scale
1 : 200 000means:- 1 cm on map = 200 000 cm in reality
- Actual distance:
7.5 × 200 000 = 1 500 000 cm
Step 2: Convert to kilometres
100 000 cm = 1 km- So:
1 500 000 cm = 15 km
Step 3: Use the speed formula
Time = Distance / SpeedTime = 15 / 60Time = 0.25 h
Step 4: Convert hours to minutes
0.25 × 60 = 15
Answer:
- The journey takes 15 minutes.
Common Mistakes to Avoid
-
Confusing direct proportion with inverse proportion.
- Direct proportion: both increase or both decrease together.
- Inverse proportion: one increases while the other decreases.
-
Forgetting the correct formula:
- Direct proportion:
y = kx - Inverse proportion:
y = k/x
- Direct proportion:
-
Thinking every straight-line graph shows direct proportion.
- A direct proportion graph must be a straight line through the origin.
-
Forgetting that inverse proportion graphs are curves, not straight lines.
-
Using
y/xto test inverse proportion.- For inverse proportion, test whether
xyis constant.
- For inverse proportion, test whether
-
Not converting units before solving speed questions.
- Example: using km with minutes without converting.
-
Mixing up the formulas:
Speed = Distance / Time- not
Time / Distance
-
Converting map scales incorrectly.
- In a ratio scale, both sides must be in the same unit.
-
Forgetting that area scale is the square of distance scale.
- If scale is
1 : 100, area scale is1 : 10 000, not1 : 100.
- If scale is
-
Rounding too early in calculations.
- Keep full values until the final answer unless instructed otherwise.
-
Writing equations without defining variables.
- Always say what
x,y,d,t, orsrepresent.
- Always say what
Exam Tips
-
Look for keywords:
- Direct proportion: “varies directly”, “proportional to”, “same rate”
- Inverse proportion: “varies inversely”, “more means less”, “product is constant”
- Rate: “per”, “for each”
- Speed: “distance”, “time”, “travel”
-
When asked to form an equation:
- Define the variables first.
- Write the proportional relationship.
- Find the constant
k. - State the final equation clearly.
-
For direct proportion questions, include phrases like:
- “Since
yis directly proportional tox,y = kx.”
- “Since
-
For inverse proportion questions, include phrases like:
- “Since
yis inversely proportional tox,y = k/x.” - or “
xyis constant.”
- “Since
-
For graph questions:
- Mention whether the graph is a straight line through the origin or a curve approaching the axes.
-
For map scale questions:
- Convert to the same units before using the scale.
- Show the unit conversion clearly for method marks.
-
For speed questions:
- Write the formula first.
- Substitute values with units.
- Convert the final answer to sensible units if needed.
-
If the answer is a time:
- Check whether the question wants the answer in hours, minutes, or seconds.
-
Always include units:
- km, cm, h, min, m/s, km/h, cm², km²
-
If area is involved:
- Remember to square the scale factor.
Quick Summary
- A ratio compares two quantities of the same kind.
- Proportion means two ratios are equal.
- In direct proportion, one quantity changes in the same ratio as the other.
- Direct proportion formula:
y = kx - In direct proportion,
y/xis constant. - The graph of direct proportion is a straight line through the origin.
- In inverse proportion, one quantity increases while the other decreases.
- Inverse proportion formula:
y = k/x - In inverse proportion,
xyis constant. - The graph of inverse proportion is a curve approaching the axes.
- A rate compares two quantities with different units; speed is distance per unit time.
- Speed formulas:
s = d/t,d = st,t = d/s - A map scale links map distance to actual distance.
- For area, square the distance scale factor.
- Always convert units carefully and include them in your final answer.
y is directly proportional to x³. When x = 2, y = 4. Find an equation connecting x and y.
the value of y when x = 6.
6 identical pipes can fill a tank completely with water in 18 minutes. Find the time taken, in minutes, for 4 pipes to fill half of the tank with water.
A lake of 2 km is represented on a map with a length of 10 cm. Find the scale of the map in the form 1 : n.

Find the length of an expressway on the map that represents an actual distance of 1480 m.
Find the actual area of a park, in m², that is represented by 0.35 cm² on the map.
A map is drawn to a scale of 1 cm to 50 m. Express the map scale in the form of 1 : n
The actual distance of a running track is 400 m. Find the length of the track, in centimetres, on the map.
The area of a garden is 15 cm² on the map. Calculate the actual area in the park, in square metres.
6 students take 20 minutes to clean a classroom. Find the time that 15 students will take to clean the classroom.
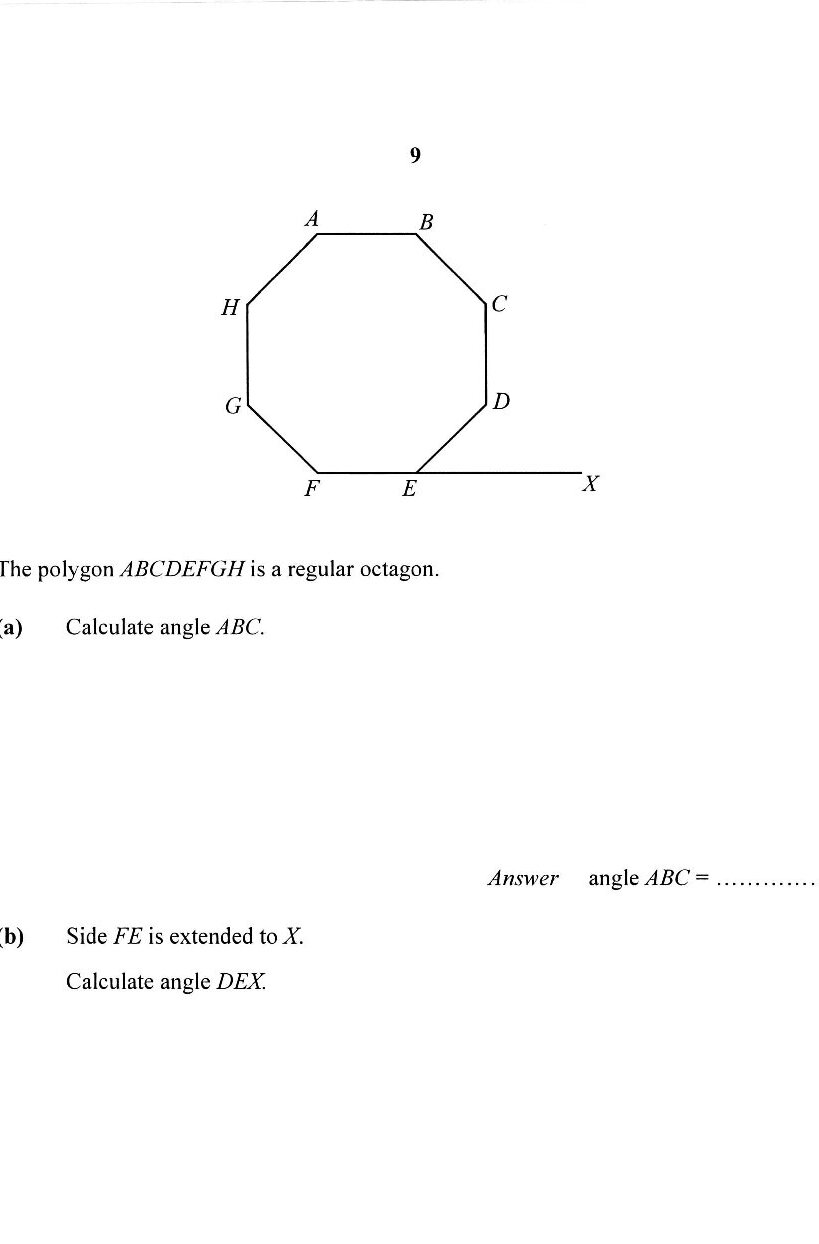
The speed limit on a certain road is 90 km/h. Write the speed limit in m/s.
Jane drives along the road for a distance of 39 km. Find the least time she will take if she does not exceed the speed limit. Give your answer in minutes.
Carl, Davy and Eric share a box of strawberries in the ratio of 2 : 5 : 7. Davy and Eric receive 36 strawberries. Find the total number of strawberries in the box.
m is directly proportional to the cube of r. Given that r = 5 when m = 2500.
r when m = -160.
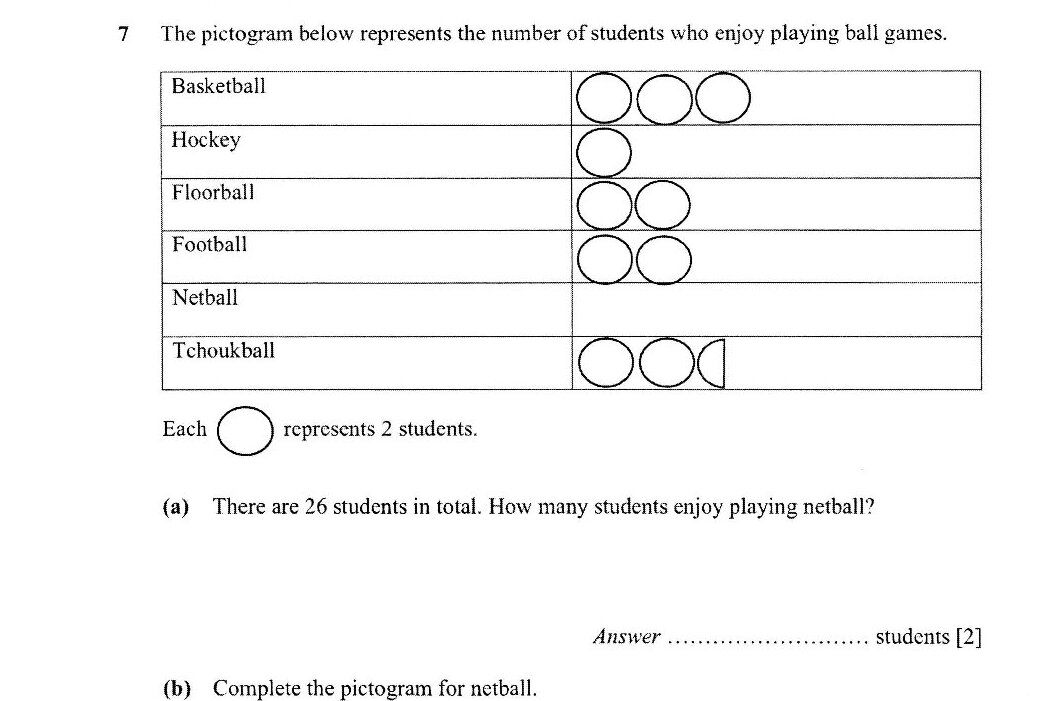
Find the ratio of students who enjoy hockey to those who enjoy tchoukball.
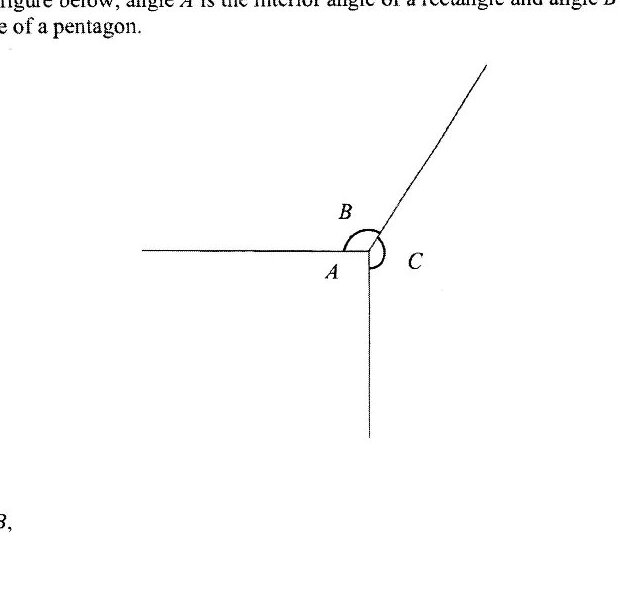
Find the value of n if angle C is the interior angle of a regular n-sided polygon.
It is given that y is inversely proportional to the square of x and when x = 10, y = 30.
Find an equation connecting x and y.
Find the value of y when x = 20.
Find the positive value of x when y = 5/6.
The number of tickets sold for the Taylor Swift concert was 55 000 when rounded off to 3 significant figures. What is the largest possible number of tickets sold?
Express 1500 g as a percentage of 130 kg.
20% of a number is 800. Find the number.
Lionel Messi takes 10 seconds on average to cover 12 m during a football match. Express the speed of Messi in km/min.
Calculate the maximum distance that Messi would run during a full soccer match of 90 minutes. Give your answer in kilometres.
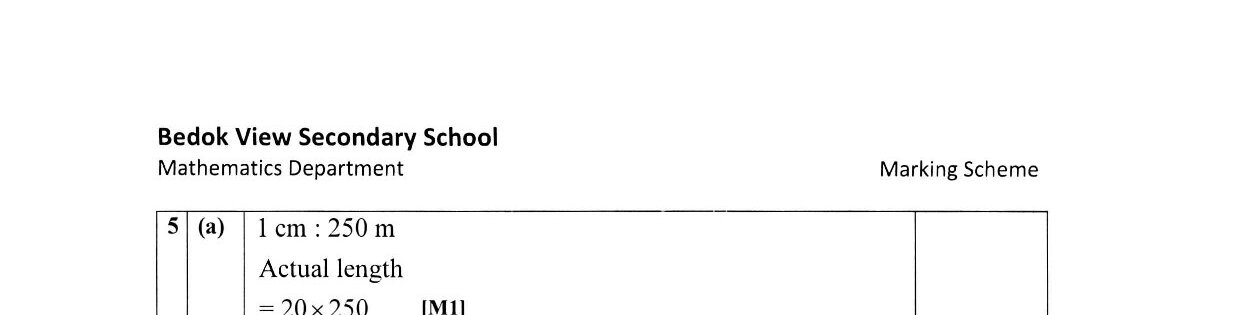
A map is drawn to a scale of 1 cm to 250 m. Given that an expressway measures 20 cm on the map, find its actual length in kilometres.
The actual width of a building is 150 m. Find the width of the building on the map.
The area of a field on the map is 8 cm². Find the actual area of the field in km².
Past year papers cover the full exam — browse by subject below.
View All Papers ›