Functions and Graphs
Functions and Graphs
Key Concepts
-
A function is a rule that links each input value to exactly one output value.
- The input is usually called x.
- The output is usually called y.
- We often write a function as an equation, such as:
-
A graph is a visual representation of the relationship between two variables.
- The horizontal axis is the x-axis.
- The vertical axis is the y-axis.
- The point where the two axes meet is called the origin,
.
-
A linear graph comes from an equation of the form:
where:
is the gradient is the y-intercept
-
In Sec 2, you also need to know the graphs of direct proportion and inverse proportion:
- Direct proportion:
— a straight line through the origin. - Inverse proportion:
— a curve (hyperbola) that approaches but never touches the axes.
- Direct proportion:
-
For the direct proportion graph
: - It is a straight line passing through the origin
. - The steeper the line, the larger the value of
. - If
, the line slopes upward to the right.
- It is a straight line passing through the origin
-
For the inverse proportion graph
: - The graph is a curve, not a straight line.
- As
increases, decreases. - The curve gets closer and closer to both axes but never touches them.
- If
, the curve lies in the first and third quadrants. - If both
and are positive (real-world contexts), the curve lies only in the first quadrant.
Not in Sec 2 2026: Quadratic functions (
), parabolas, vertex, axis of symmetry, and sketching quadratic graphs are not part of the Sec 2 syllabus. These are Sec 3 E-Mathematics topics. The notes below on quadratic functions are kept for reference only.
-
A quadratic function has the form:
where:
, , and are numbers - The highest power of
is 2
-
The graph of a quadratic function is called a parabola.
-
The value of a affects the shape and direction of the parabola:
- If
, the parabola opens upwards. - If
, the parabola opens downwards. - If
is larger, the parabola is narrower. - If
is smaller, the parabola is wider.
- If
-
The intercepts are where the graph crosses the axes:
- x-intercept(s): where the graph crosses the x-axis
- At these points,
- At these points,
- y-intercept: where the graph crosses the y-axis
- At this point,
- At this point,
- x-intercept(s): where the graph crosses the x-axis
-
The vertex of a parabola is its turning point.
- For an upward-opening parabola, the vertex is the minimum point.
- For a downward-opening parabola, the vertex is the maximum point.
-
The parabola has a line called the axis of symmetry.
- It is a vertical line passing through the vertex.
- The left and right sides of the parabola are mirror images of each other.
-
To interpret a graph means to read information from it and explain what it shows.
- For example:
- whether the graph is increasing or decreasing
- the greatest or least value
- where it crosses the axes
- what the shape suggests about the relationship between variables
- For example:
-
The gradient of a linear graph tells us how steep the line is.
-
It shows how much
changes when increases by 1. -
Formula:
-
-
The y-intercept of a linear graph is the value of
when . - In
, the y-intercept is .
- In
Important Definitions
-
Function: a rule or relationship in which each input value has exactly one output value.
-
Variable: a symbol, such as
or , that represents a value that can change. -
Graph: a diagram that shows the relationship between two variables on axes.
-
x-axis: the horizontal number line on a graph.
-
y-axis: the vertical number line on a graph.
-
Origin: the point
where the x-axis and y-axis meet. -
Linear function: a function of the form
, whose graph is a straight line. -
Gradient: the steepness of a straight line, found by
. -
y-intercept: the point where a graph crosses the y-axis.
-
x-intercept: the point where a graph crosses the x-axis.
-
Direct proportion graph: the graph of
, a straight line through the origin. -
Inverse proportion graph: the graph of
, a curve that approaches the axes but never touches them. -
Quadratic function: a function of the form
, where . (Sec 3 topic — not assessed in Sec 2 2026) -
Parabola: the U-shaped or inverted U-shaped graph of a quadratic function. (Sec 3 topic)
-
Vertex: the turning point of a parabola. (Sec 3 topic)
-
Axis of symmetry: the vertical line passing through the vertex that divides the parabola into two equal halves. (Sec 3 topic)
-
Maximum point: the highest point on a downward-opening parabola. (Sec 3 topic)
-
Minimum point: the lowest point on an upward-opening parabola. (Sec 3 topic)
-
Intercept: a point where a graph crosses an axis.
-
Sketch: a neat graph showing the main features clearly, without needing every point plotted exactly.
Worked Examples
Example 1: Find the gradient and y-intercept of a linear graph
Given:
Step 1: Compare with the form
So:
Step 2: State the answers
- Gradient = 3
- y-intercept = -5
Step 3: Write the y-intercept as a point
When
So the y-intercept is:
Answer:
- Gradient = 3
- y-intercept =
Not in Sec 2 2026: Examples 2 and 3 below involve quadratic graphs (parabolas), which are Sec 3 topics. They are kept here for reference only. Focus on Example 1 (linear graphs) for Sec 2.
Example 2: Find the intercepts of a quadratic graph
Given:
Find the y-intercept
Step 1: Let
So the y-intercept is:
Find the x-intercepts
Step 2: Let
Step 3: Factorise
So:
Therefore the x-intercepts are:
Answer:
- y-intercept =
- x-intercepts =
and
Example 3: Find the vertex and sketch the parabola
Given:
Step 1: Identify the value of
Since
Step 2: Find the intercepts
y-intercept:
Let
So y-intercept is:
x-intercepts:
Let
Factorise:
So:
x-intercepts are:
Step 3: Find the axis of symmetry
The axis of symmetry is midway between the two x-intercepts. Take the average of the x-intercept values:
So the axis of symmetry is
Step 4: Find the vertex (turning point)
The vertex lies on the axis of symmetry. Substitute
So the vertex is:
Step 5: Describe the sketch
- Upward-opening parabola
- Crosses the x-axis at
and - Crosses the y-axis at
- Lowest point is the vertex
- Symmetrical about the line
Answer:
- Vertex =
- Axis of symmetry =
- x-intercepts =
, - y-intercept =
Common Mistakes to Avoid
-
Confusing x-intercept with y-intercept
- x-intercept: set
- y-intercept: set
- x-intercept: set
-
Forgetting that in a quadratic function,
- If
, the function is no longer quadratic.
- If
-
Drawing a parabola with the wrong opening direction
- Check the sign of
: - positive → upwards
- negative → downwards
- Check the sign of
-
Plotting the vertex wrongly due to arithmetic errors when finding the average of the x-intercepts.
-
Forgetting to substitute the x-value of the axis of symmetry back into the equation to find the y-coordinate of the vertex.
-
Assuming every quadratic graph cuts the x-axis twice
- Some parabolas touch the x-axis once.
- Some do not cross the x-axis at all.
-
Using unequal scales on the axes
- This makes the graph misleading.
-
Drawing the parabola with sharp corners
- A parabola must be a smooth curve.
-
Mixing up gradient and y-intercept in
is gradient is y-intercept
-
Calculating gradient incorrectly
-
Always use:
-
Not the other way round.
-
Exam Tips
-
When asked to state the gradient, write a number, not just “steep” or “positive”.
-
When asked to give the y-intercept, it is best to write it as a point, for example:
-
In sketching questions, always show the important features:
- intercepts
- vertex
- axis of symmetry
- correct opening direction
-
If the equation is quadratic, check:
- sign of
- intercepts
- turning point
- sign of
-
Use mathematical keywords in your answer:
- gradient
- y-intercept
- x-intercept
- vertex
- axis of symmetry
- maximum
- minimum
-
For graph interpretation, mention:
- whether the graph increases or decreases
- the highest or lowest point
- where the graph crosses the axes
-
If the question asks for the relationship shown by a linear graph:
- positive gradient means
increases as increases - negative gradient means
decreases as increases
- positive gradient means
-
Write coordinates in the correct form:
-
Check your final sketch:
- Does it match the intercepts you found?
- Is the graph symmetrical if it is a parabola?
- Is the shape correct?
Quick Summary
-
A linear function has the form
. -
In
, is the gradient and is the y-intercept. -
Gradient is calculated using:
-
A direct proportion graph has the form
: a straight line through the origin. -
An inverse proportion graph has the form
: a curve that approaches the axes but never touches them. -
For linear graph sketching, show: gradient (steepness), y-intercept, and whether the line slopes up or down.
-
x-intercept is found by setting
; y-intercept is found by setting .
Not in Sec 2 2026: Quadratic functions, parabolas, vertex, and axis of symmetry are Sec 3 topics. The following points are for future reference only.
-
A quadratic function has the form:
-
The graph of a quadratic function is a parabola.
-
If
, the parabola opens upwards; if , it opens downwards. -
The vertex is the turning point of the parabola.
-
The x-coordinate of the vertex is:
-
The parabola is symmetrical about its axis of symmetry.
-
A good sketch must show the intercepts, vertex, symmetry, and correct shape.
The table of values below is for the straight line y = -3 - 2x.
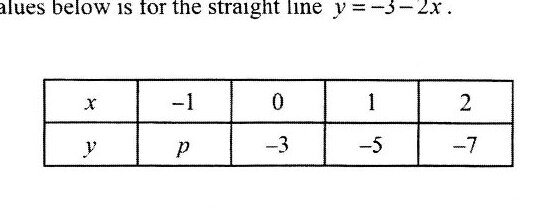
On the grid on page 9, draw the line with equation y = -3 - 2x.
Using your graph, find the value of x when y = -4.6.
On the same grid, draw and label the line y = -2.
Using your graph, write down the coordinates of the point where the line y = -2 meets the line y = -3 - 2x.
ABC is a straight line. AB = 5 cm, DB = 12 cm, DC = 16 cm and angle CBD = 90°. Find the length of AD.
![A table with two rows (x and y) and five columns. First row (x values): -1, 1, 2, 3. Second row (y values): 7, 3, [blank], -1. The table shows given values and requires completion of missing y-value(s).](/assets/question-images/sec2-math_Math_Sec2NA_SA2_2023_Bartley_Sec_p10_q11.jpg)
Find the number of students who scored at least 40 marks.
Find the percentage of students who scored less than 20 marks.
Use your graph to find the value of x when y = − 0.6.
State the y - intercept of the graph.
State the gradient of the line y = 5 − 2x.
Write down the gradient of the line y = (x+4)/2.
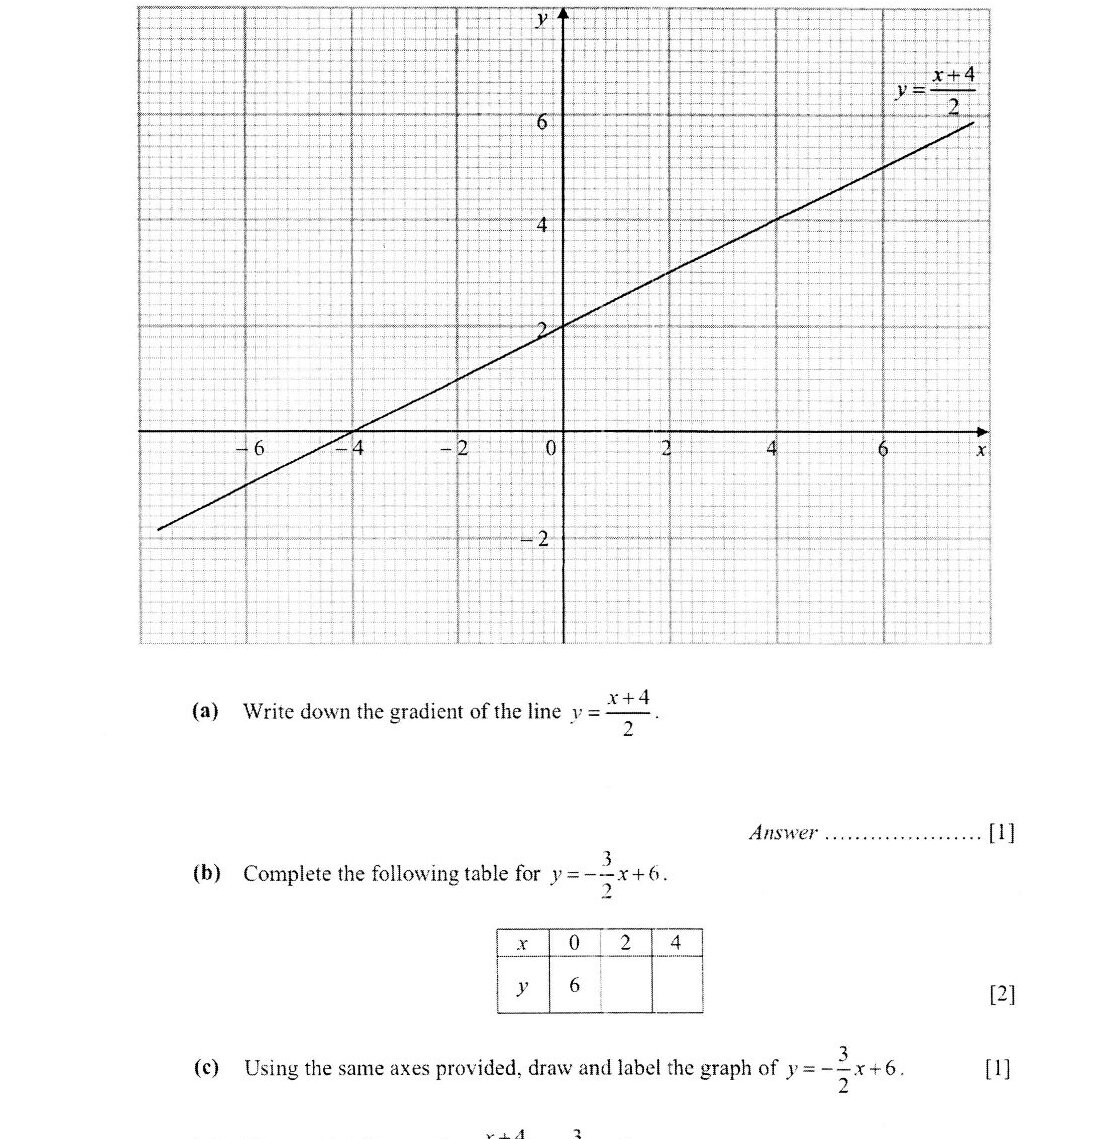
Complete the following table for y = -3/2 x + 6.
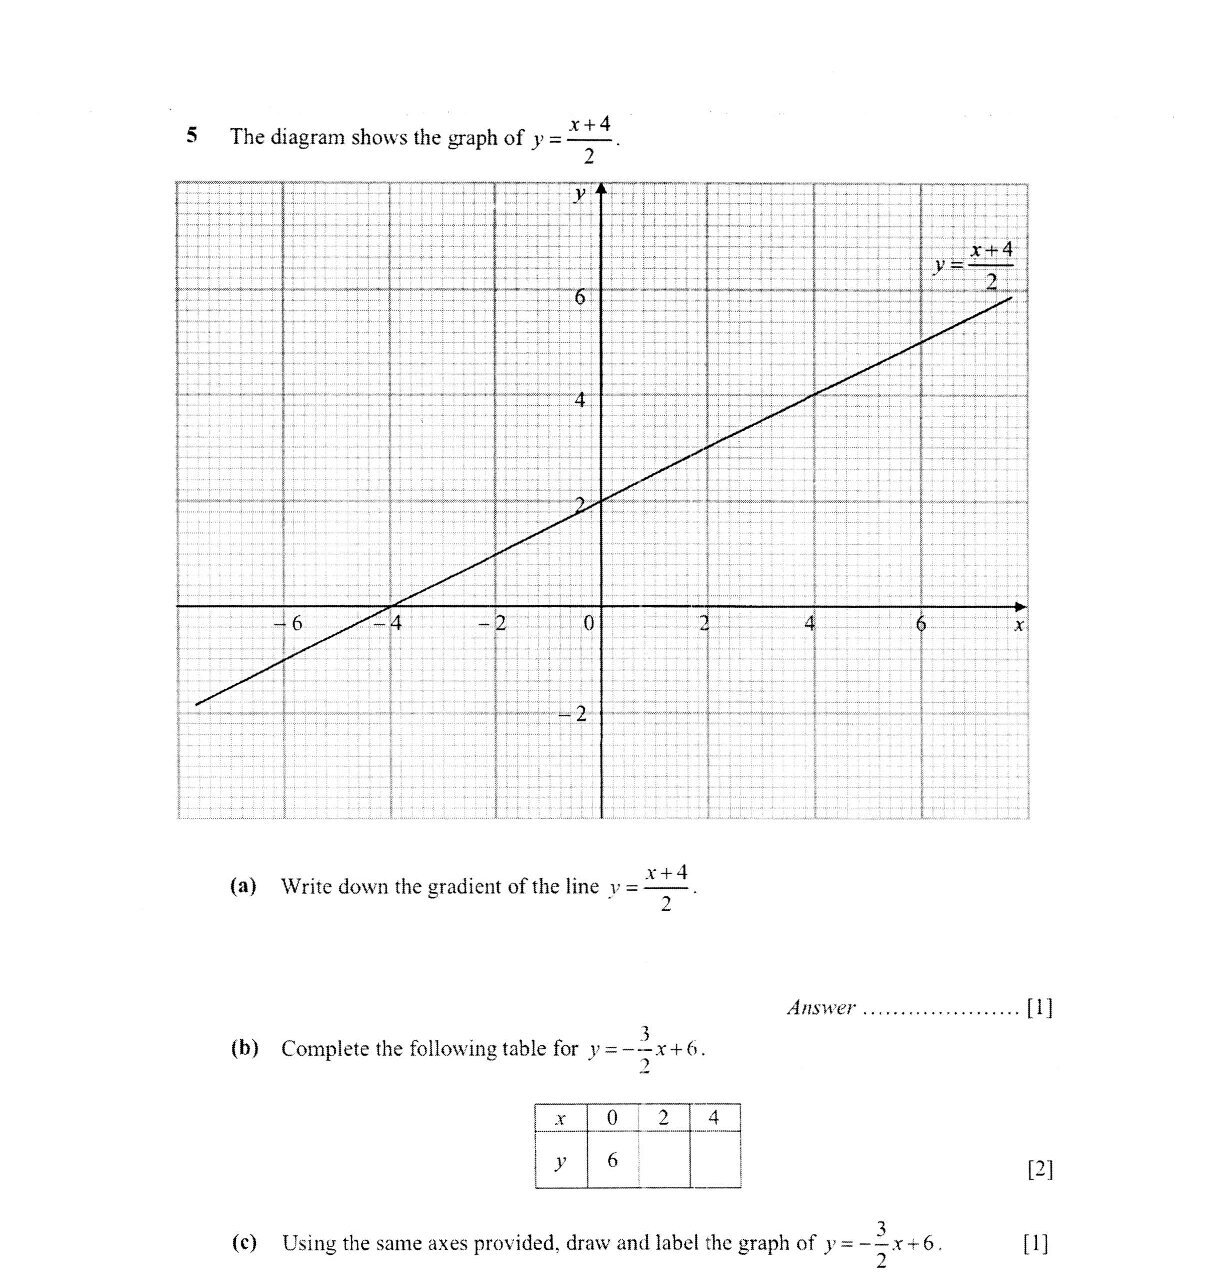
Using the same axes provided, draw and label the graph of y = -2/2 x + 6.
The grid shows the points A, B and C.
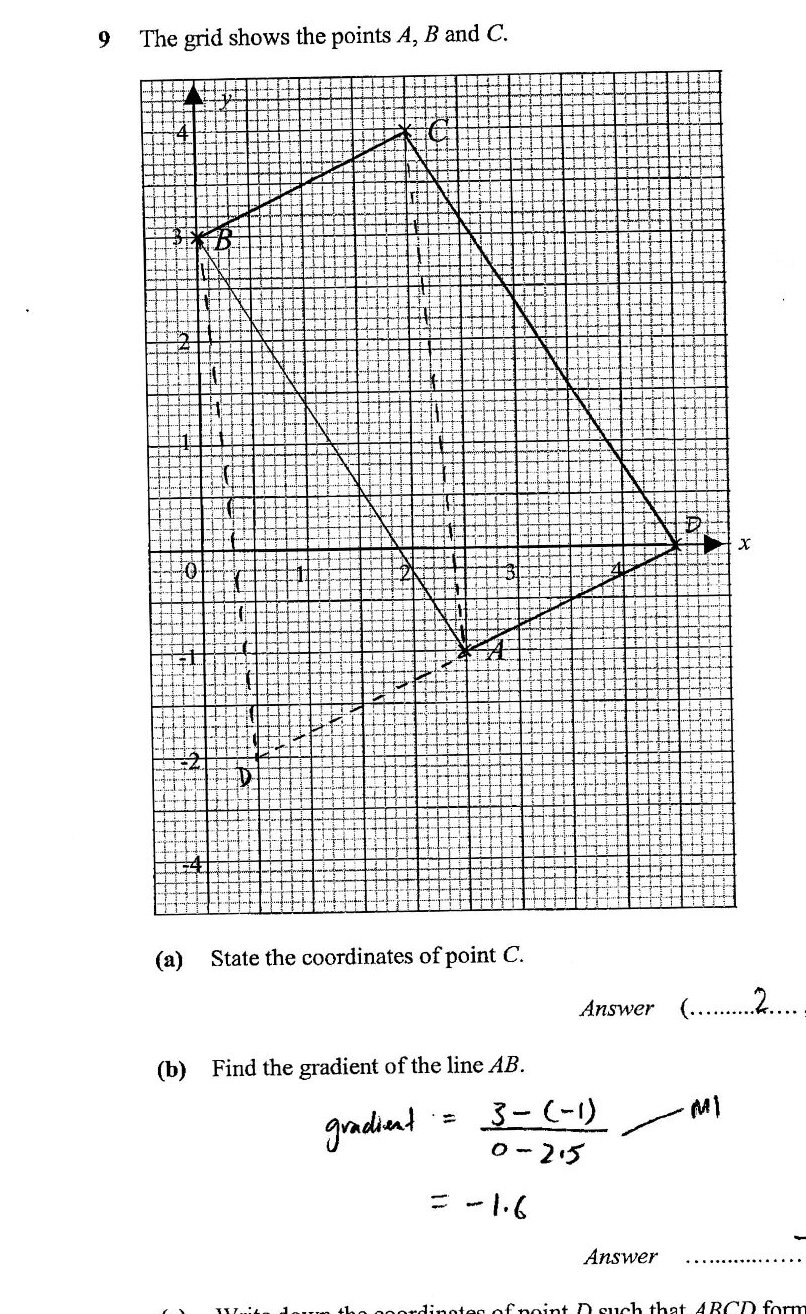
State the coordinates of point C.
Find the gradient of the line AB.
State the coordinates of point C.
Find the gradient of the line AB.
Complete this table of values for y = 1/2 x + 1.
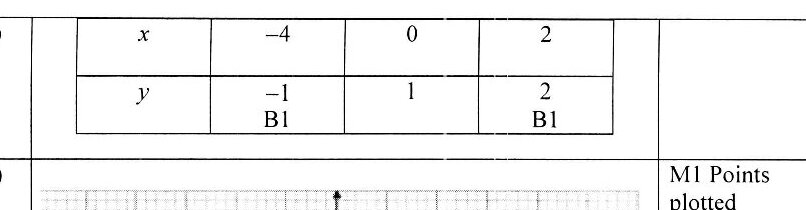
On the axes given below, draw the line y = 1/2 x + 1.

Express (x+1)/5 - (5x+2)/6 as a fraction in its simplest form.
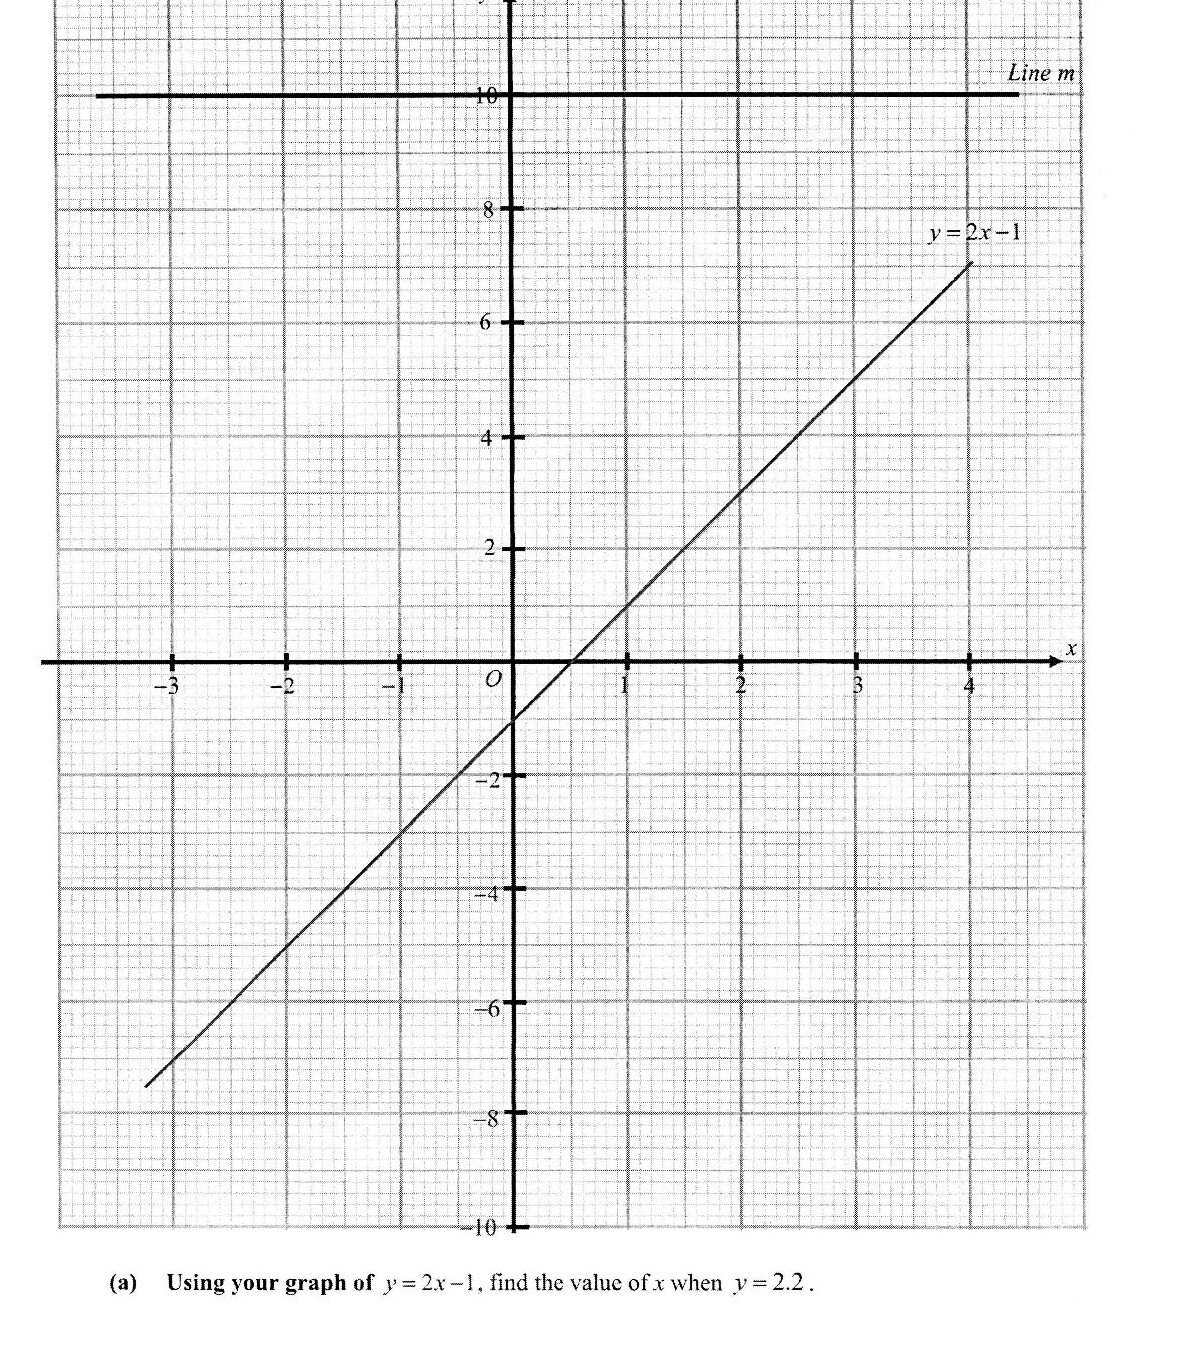
Using your graph of y = 2x - 1, find the value of x when y = 2.2.
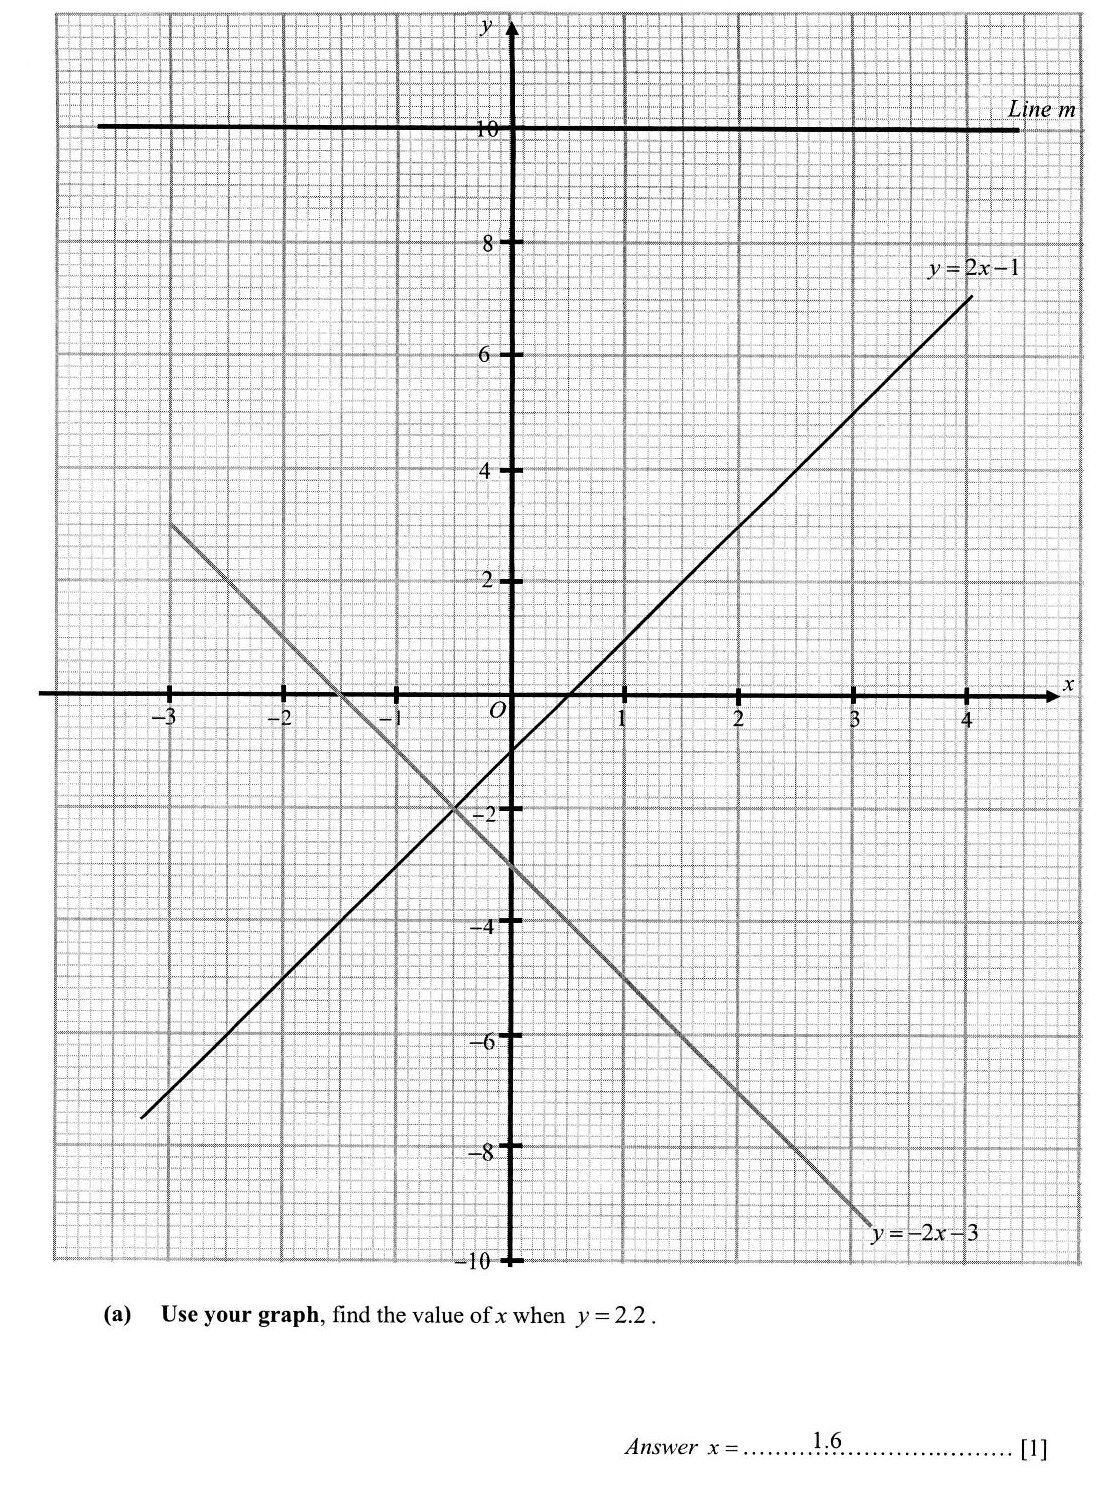
Write down the coordinates of the point where the line y = 2x - 1 cuts the x-axis.
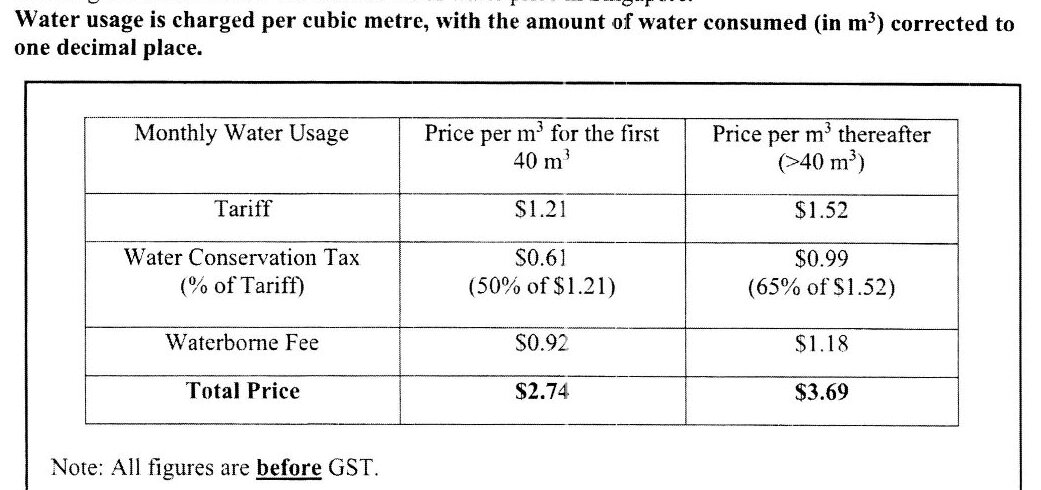
Calculate the price of water (before GST) that the water tanker, in (a), holds when full.
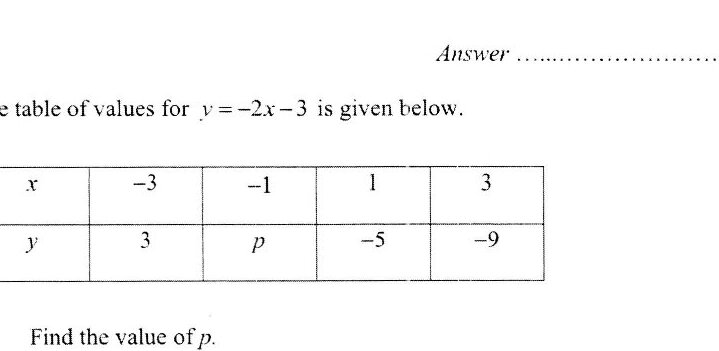
The table of values for y = -2x - 3 is given below. Find the value of p.
Draw and label the graph of y = -2x - 3 on the diagram provided on page 5.
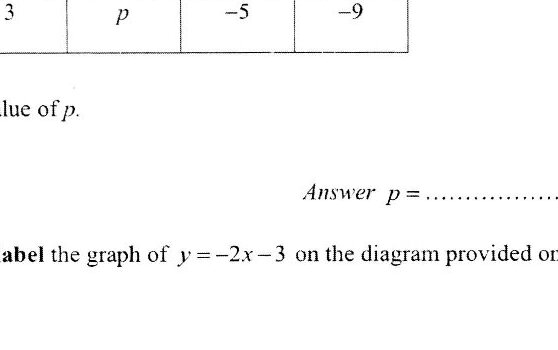
Using your graph of y = 2x - 1, find the value of x when y = 2.2.
Write down the coordinates of the point where the line y = 2x - 1 cuts the x-axis.
Past year papers cover the full exam — browse by subject below.
View All Papers ›