Energy in Food
Energy in Food
Key Concepts
1. Food as a Form of Chemical Energy
- Food contains chemical energy stored in its nutrients (carbohydrates, fats, and proteins)
- When we eat food, the body breaks it down to release this stored chemical energy
- Different foods store different amounts of energy
- High-energy foods: Rice, bread, butter, oil, meat
- Low-energy foods: Vegetables, fruits (mostly water)
2. The Sun as the Ultimate Source of Energy
- The Sun is the main source of energy for most living things on Earth
- The Sun provides light energy that plants use to make food
- Without the Sun, most life on Earth would not survive
- Energy flows from the Sun → plants → animals → decomposers
3. Photosynthesis: How Plants Capture Energy
Plants use photosynthesis to capture light energy from the Sun and convert it into chemical energy stored in food.
The photosynthesis process:
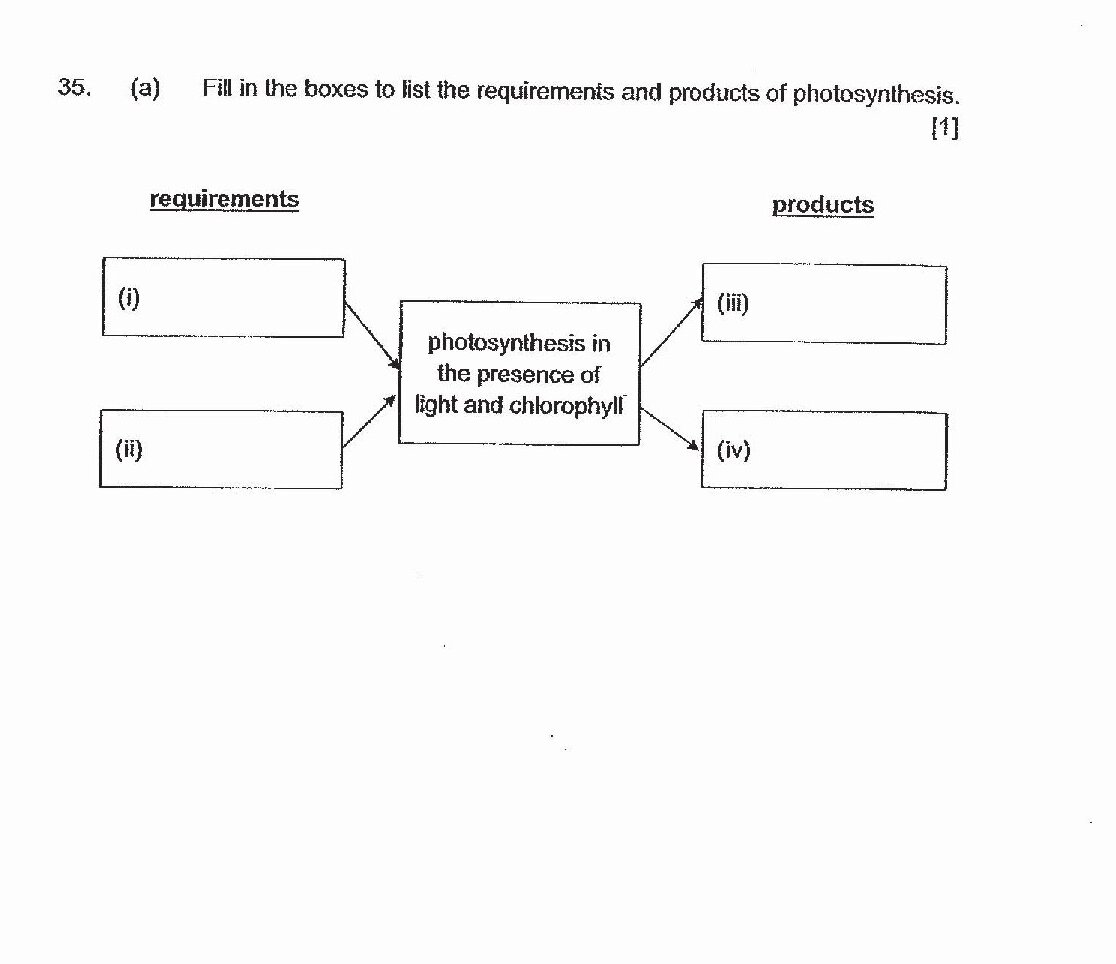
- Input: Light energy (from Sun) + Water + Carbon dioxide (from air)
- Process: Takes place in the green leaves (contain chlorophyll)
- Output: Glucose (sugar/food) + Oxygen
Energy conversion: Light energy → Chemical energy (stored in glucose)
Simple equation: Light + Water + Carbon dioxide → Glucose + Oxygen
3a. How Light Affects Photosynthesis: The Starch Test
- Excess glucose produced by photosynthesis is converted and stored as starch in the leaf
- Light is essential for photosynthesis — without light, photosynthesis cannot occur
- If part of a leaf is deprived of light, that part cannot photosynthesise and no starch is produced there
The iodine test for starch:
- Iodine solution is used to detect the presence of starch
- Starch present → iodine turns blue-black
- Starch absent → iodine remains brown (no colour change)
The black-strip experiment:
- A black strip of paper is placed over part of a leaf to block out light
- The covered area cannot photosynthesise → no starch is produced
- When iodine is applied: covered area stays brown; uncovered area turns blue-black
Full causal chain (must state all links): Black strip blocks out light → cannot photosynthesise → no starch produced → iodine does not turn blue-black (remains brown)
3b. How CO2 Levels Affect Photosynthesis
- Plants need carbon dioxide as a raw material for photosynthesis
- More CO2 available → faster rate of photosynthesis → more glucose (food) produced → faster plant growth
- Animals (including fish) respire and release CO2 into their surroundings
- Fish release dissolved CO2 into the water in a tank
- This increases the CO2 available to aquatic plants, boosting their photosynthesis
- This is why a water plant in a tank with fish will grow bigger than one in a tank with no fish
4. How Animals Get Energy: Food Chains
Animals cannot make their own food like plants do, so they must eat other organisms to get energy.
Food chains show how energy is transferred from one organism to another:
- Producers: Plants (make their own food using photosynthesis)
- Consumers: Animals that eat plants or other animals
- Primary consumers: Herbivores (eat plants)
- Secondary consumers: Carnivores (eat herbivores)
- Tertiary consumers: Top carnivores (eat other carnivores)
Example food chains in Singapore:
- Grass → Grasshopper → Frog → Snake
- Plant → Caterpillar → Bird → Hawk
- Plankton → Fish → Dolphin
5. How Energy is Released from Food: Respiration
Respiration is the process by which living things release energy from food for use in their body.
The respiration process:
- Input: Food (glucose) + Oxygen
- Process: Takes place in all living cells
- Output: Energy (used by the body) + Carbon dioxide + Water
Energy released: Chemical energy (from food) → Usable energy for the body
Simple equation: Food + Oxygen → Energy + Carbon dioxide + Water
Where does respiration happen?
- In plants: All cells (roots, stems, leaves)
- In animals: All cells throughout the body
- In humans: Happens in every living cell (muscles, brain, heart, etc.)
6. Energy Stored in Different Nutrients
Different nutrients provide different amounts of energy and serve different purposes:
| Nutrient | Type | Energy Level | Function | Examples |
|---|---|---|---|---|
| Carbohydrates | Quick energy | Medium | Quick energy for movement and daily activities | Rice, bread, noodles, potato |
| Fats | Long-term energy | High | Store more energy; keeps us warm | Butter, oil, nuts, fatty meat |
| Proteins | Structural | Medium | Growth, repair, and building muscles | Meat, fish, eggs, beans |
Key points:
- Fats store more energy than carbohydrates per gram
- Proteins are mainly for growth, not quick energy
- Carbohydrates are quickly burned for daily activities
7. Energy Flow in Food Chains
Energy decreases at each level of a food chain because some energy is lost:
What happens to energy at each level?
- Energy lost as heat: Used for movement, breathing, keeping warm (respiration)
- Energy used for growth: Stored in body tissues
- Energy not eaten: Parts of the organism that are not consumed
Energy percentage rule:
- Only about 10% of energy passes to the next level
- 90% is lost or used up by the organism
Example:
Grass: 100 units of energy
  ↓ (only 10% transferred)
Grasshopper: 10 units of energy
  ↓ (only 10% transferred)
Frog: 1 unit of energy
Why energy decreases:
- Some organisms are not eaten (energy lost)
- Some energy is used for movement, breathing, and keeping warm
- Some energy is lost as waste (faeces, urine)
8. Why We Need Energy: All Life Processes (MRS GREN)
All living things need energy to carry out life processes. Remember MRS GREN:
- M - Movement: Moving muscles, running, walking, swimming
- R - Respiration: Releasing energy from food (inside cells)
- S - Sensitivity: Responding to surroundings (feeling heat, light, sound)
- G - Growth: Building new cells and growing bigger
- R - Reproduction: Making babies/offspring; making seeds
- E - Excretion: Getting rid of waste products
- N - Nutrition: Eating and digesting food
In humans specifically, we need energy for:
- Movement (all physical activity)
- Growth (childhood and repair of damaged tissue)
- Keeping warm (maintaining body temperature)
- Thinking and brain function
- Maintaining all body functions even when resting
9. Comparing Energy in Different Foods
Foods can be ranked by how much energy they provide:
High-energy foods (a lot of energy):
- Rice, bread, pasta (carbohydrates)
- Butter, oil, nuts (fats)
- Meat, fish, cheese (proteins + fats)
Medium-energy foods:
- Eggs, tofu, beans (proteins)
- Potatoes, sweet corn (carbohydrates)
Low-energy foods (little energy):
- Vegetables: leafy greens, carrots, broccoli
- Fruits: apples, oranges, watermelon (mostly water)
- Salad (mostly water)
Why the difference?
- High-energy foods: Contain more nutrients concentrated in smaller volume
- Low-energy foods: Contain more water, less nutrients
Important Definitions
| Term | Definition | Example |
|---|---|---|
| Chemical energy | Energy stored in food that can be released when food is broken down | The energy in rice |
| Photosynthesis | Process where plants use light energy to make food from water and carbon dioxide | Happens in green leaves in sunlight |
| Respiration | Process where living things release energy from food using oxygen | Happens in all living cells all the time |
| Food chain | A series showing how energy passes from plants to animals | Grass → Goat → Lion |
| Producer | Organism that makes its own food using photosynthesis | Plants |
| Consumer | Organism that eats other organisms to get energy | Animals |
| Herbivore | Animal that eats only plants (primary consumer) | Rabbit, cow, grasshopper |
| Carnivore | Animal that eats other animals (secondary or tertiary consumer) | Lion, eagle, frog |
| Nutrient | Substance in food needed by the body | Carbohydrates, fats, proteins, vitamins, minerals |
| Carbohydrate | Nutrient that provides quick energy; found in rice, bread, pasta | Glucose, starch |
| Fat | Nutrient that stores long-term energy and keeps us warm | Oil, butter, nuts |
| Protein | Nutrient mainly needed for growth and repair of body tissues | Meat, eggs, beans |
| Energy loss | Energy that is not passed to the next level in a food chain | Lost as heat, movement, waste |
| Starch | A substance in which plants store excess glucose produced by photosynthesis | Found in leaves and seeds |
| Iodine test | A test using iodine solution to detect starch; iodine turns blue-black if starch is present, remains brown if starch is absent | Used to show whether photosynthesis has occurred in a leaf |
Worked Examples (PSLE-Style Questions)
Example 1: Photosynthesis and Energy
Question: Where does a plant get the energy to make its food, and what process is this called?
Answer:
- A plant gets energy from sunlight (light energy from the Sun)
- The process is called photosynthesis
- In photosynthesis, light energy is converted into chemical energy and stored in food (glucose)
- This happens in the green leaves which contain chlorophyll
Example 2: Respiration and Energy Release
Question: When we eat food, how is the energy in the food released and used in our body?
Answer:
- The energy is released through a process called respiration
- During respiration, food (glucose) reacts with oxygen in our cells
- This releases usable energy that our body uses for movement, growth, keeping warm, and other activities
- Respiration also produces carbon dioxide and water as waste products
- Carbon dioxide is breathed out through our lungs
Example 3: Food Chains and Energy
Question: In the food chain: Grass → Locust → Frog → Snake
- Which organism is the producer?
- Which organism is a primary consumer?
- Why is there less energy in the snake than in the grass?
Answer:
- Producer: Grass (makes its own food using photosynthesis)
- Primary consumer: Locust (eats plants/grass)
- Why less energy in snake:
- Energy is lost at each level of the food chain
- Some energy is used by each organism for respiration (movement, keeping warm, growth)
- Some energy is lost as heat
- Not all of the organism is eaten (only about 10% of energy passes to the next level)
Example 4: Nutrients and Energy
Question: Why are some foods called “high-energy foods” while others are “low-energy foods”? Give examples of each.
Answer:
- High-energy foods contain more nutrients packed together:
- Examples: Rice, bread, butter, oil, meat
- These contain more carbohydrates and fats
- Low-energy foods contain a lot of water and less nutrients:
- Examples: Vegetables (leafy greens, carrots), fruits (apples, oranges), salad
- These have less carbohydrates, fats, and proteins per serving
- Why the difference: High-energy foods have nutrients concentrated in a smaller volume, while low-energy foods are mostly water
Example 5: Life Processes and Energy (MRS GREN)
Question: A growing child needs a lot of energy. Name three life processes that require this energy.
Answer:
- Growth - Building new cells and growing taller
- Movement - Running, playing, physical activity
- Respiration - Releasing energy from food in every cell
- Keeping warm - Maintaining body temperature
- (Or any three from MRS GREN)
Mark-earning phrase: “All these processes require energy from food.”
Example 6: Photosynthesis Equation
Question: Write the word equation for photosynthesis and explain what happens to the energy.
Answer: Equation: Light energy + Water + Carbon dioxide → Glucose + Oxygen
Energy explanation:
- Input energy: Light energy from the Sun
- Output energy: Chemical energy stored in glucose (food)
- The plant converts light energy into chemical energy that is stored in the food
- When the plant or an animal eats the plant, this chemical energy is released during respiration
Example 7: Comparing Organisms in a Food Chain
Question: In the food chain: Plant → Grasshopper → Frog Why can there not be a fourth level (like Frog → Hawk → Eagle → Lion) without running out of energy?
Answer:
- At each level of the food chain, only about 10% of the energy is passed to the next level
- The rest is lost as:
- Heat (from respiration/movement)
- Energy used for movement and breathing
- Energy in parts not eaten
- Energy in waste
- After many levels, there is not enough energy left to support the next consumer
- Eventually, there is too little energy to feed a large predator
Example 8: Uses of Energy in the Body
Question: List four ways that humans use the chemical energy from food.
Answer:
- Movement - Contracting muscles for walking, running, sports
- Growth - Building new cells, growing taller, repairing damaged tissue
- Keeping warm - Maintaining body temperature in cold environments
- Thinking and brain function - Brain uses a lot of energy
- Breathing and heartbeat - Maintaining vital functions even at rest
- Digestion - Breaking down food
(Any four answers from the list above are acceptable)
Example 9: Fish Tank Experiment (Photosynthesis + Respiration)
Question: Two tanks each contain the same water plant. Tank A also contains fish; Tank B has no fish. After two weeks, the plant in Tank A is bigger. Explain why.
Answer (step-by-step):
- Identify the difference: Tank A has fish; Tank B does not.
- Link to a biological process: Fish respire and release carbon dioxide into the water.
- Chain of effects: The extra dissolved CO2 in Tank A means the water plant has more CO2 available for photosynthesis.
- Conclude: With more CO2, the plant in Tank A can photosynthesize faster, produce more food (glucose), and therefore grow bigger than the plant in Tank B.
Key mark-earning phrase: ‘The fish respire and release carbon dioxide into the water, increasing the rate of photosynthesis of the plant.’
Common Mistakes to Avoid
❌ Mistake 1: Thinking animals get energy directly from the Sun
- Wrong: “Lions get energy from the Sun”
- Correct: Lions get energy from eating meat (which comes from herbivores that eat plants, which capture Sun’s energy)
- Key: Only plants can directly capture the Sun’s energy through photosynthesis
❌ Mistake 2: Confusing photosynthesis and respiration
- Wrong: “Plants use respiration to make food”
- Correct:
- Photosynthesis = Making food using light energy (plants only)
- Respiration = Releasing energy from food (all living things)
- Key: Plants do BOTH - they make food through photosynthesis AND release energy through respiration
❌ Mistake 3: Thinking respiration only happens during exercise
- Wrong: “We only respire when we run or exercise”
- Correct: Respiration happens in every cell, all the time, even when sleeping
- Key: Respiration is continuous - it’s how our body releases energy 24/7
❌ Mistake 4: Not understanding energy loss in food chains
- Wrong: “A grasshopper stores all the energy from the grass it eats”
- Correct: A grasshopper only stores about 10% of the energy; the rest is lost as heat and used for its own activities
- Key: Energy decreases at each level - this is why there are usually only 3-4 levels in a food chain
❌ Mistake 5: Thinking all nutrients provide the same amount of energy
- Wrong: “Carbohydrates and fats provide the same amount of energy”
- Correct: Fats store more energy than carbohydrates per gram
- Key: Fats = long-term energy storage; Carbohydrates = quick energy
❌ Mistake 6: Confusing energy loss with waste
- Wrong: “Energy is lost because animals produce waste”
- Correct: Energy is lost as heat from respiration AND through waste products
- Key: Most energy loss is from respiration (movement, keeping warm, growth), not just waste
❌ Mistake 7: Thinking plants don’t need respiration
- Wrong: “Plants only photosynthesize; they don’t respire”
- Correct: Plants do both - they photosynthesize to make food, and they respire to release energy from that food
- Key: Plants respire day and night, but only photosynthesize during the day
❌ Mistake 8: Writing incomplete respiration equations
- Wrong: “Food → Energy”
- Correct: “Food + Oxygen → Energy + Carbon dioxide + Water”
- Key: Don’t forget oxygen, carbon dioxide, and water in the equation
❌ Mistake 9: Saying the black strip ‘covers’ the leaf instead of ‘blocks out light’
- Wrong: ‘The black strip covers part of the leaf’
- Correct: ‘The black strip blocks out light from that part of the leaf’
- Key: The examinable variable is the presence or absence of light, not the physical covering
❌ Mistake 10: Giving an incomplete causal chain for the iodine test
- Wrong: ‘No light means no starch, so iodine stays brown’
- Correct: ‘No light → cannot photosynthesise → no starch produced → iodine will not turn blue-black’
- Key: Every link in the chain must be stated; skipping ‘cannot photosynthesise’ loses a mark
❌ Mistake 11: Naming the black strip as the factor being tested
- Wrong: ‘The factor being tested is the black strip’
- Correct: ‘The factor being tested is the presence or absence of light’
- Key: Always name the scientific variable, not the equipment used to manipulate it
❌ Mistake 12: Saying ‘more CO2’ without naming the process that produced it
- Wrong: ‘The plant grows bigger because there is more carbon dioxide in Tank A.’
- Correct: ‘The fish respire and release carbon dioxide into the water. This increases the CO2 available, so the plant photosynthesizes faster and grows bigger.’
- Key: You must name the process (respiration) and the organism performing it. Stating ‘more CO2’ alone is incomplete and will lose marks.
❌ Mistake 13: Omitting the keyword ‘respire’ in experiment answers
- Wrong: ‘Fish release CO2 into the water.’
- Correct: ‘Fish respire and release carbon dioxide into the water.’
- Key: Examiners look for the word ‘respire’ — it shows you understand the biological mechanism, not just the outcome.
Exam Tips with Mark-Earning Phrases
Tip 1: Use “Chemical Energy” Precisely
- Instead of: “Food has energy”
- Say: “Food contains chemical energy that is stored in nutrients”
- Mark gain: +1 mark for using correct terminology
Tip 2: Explain the Source of Energy
- Instead of: “We need energy”
- Say: “We need energy from food which ultimately comes from the Sun through photosynthesis”
- Mark gain: Connects all concepts; shows deeper understanding
Tip 3: Use “Converted” or “Transformed” When Discussing Energy Changes
- Instead of: “Light energy becomes food”
- Say: “Light energy is converted into chemical energy and stored in food”
- Mark gain: Shows understanding of energy conservation
Tip 4: Name the Specific Processes
- Instead of: “Plants make food”
- Say: “Through photosynthesis, plants use light energy to make food”
- Mark gain: Correct process terminology = automatic mark
Tip 5: Explain BOTH Directions for Food Chains
When answering food chain questions:
- Name the producers: “Plants are producers because they make their own food”
- Name the consumers: “Herbivores are primary consumers because they eat plants”
- Explain energy transfer: “Only about 10% of energy is transferred to the next level”
- Mark gain: Comprehensive answer = full marks
Tip 6: Use “Respiration” vs “Breathing”
- Wrong: “Breathing releases energy from food”
- Right: “Respiration releases energy from food; breathing is just one part of respiration”
- Mark gain: Shows precise scientific knowledge
Tip 7: Name MRS GREN Processes Correctly
When asked why we need energy:
- Say: “We need energy for movement, respiration, sensitivity, growth, reproduction, excretion, and nutrition”
- Or pick specific relevant ones: “For growth and movement in humans”
- Mark gain: Naming specific processes shows detailed knowledge
Tip 8: Complete Equations Fully
- Instead of: “Glucose + O₂ → Energy”
- Say: “Glucose + Oxygen → Energy + Carbon dioxide + Water”
- Mark gain: Complete equations get full marks
Tip 9: Compare High and Low Energy Foods Correctly
- Instead of: “Rice has more energy than lettuce”
- Say: “Rice is a high-energy food containing carbohydrates and fats, while lettuce is a low-energy food mostly containing water”
- Mark gain: Shows understanding of nutrient composition
Tip 10: Explain Why Not All Energy Transfers
- Instead of: “Energy is lost”
- Say: “Energy is lost as heat during respiration, used for movement and growth, and in parts of organisms not eaten”
- Mark gain: Specific explanation = more marks
Tip 11: Use the 3-Step Approach for Experiment Questions
- Identify the purpose — what is the experiment trying to show?
- Consider the variable — how does the manipulated factor (e.g. light) affect the relevant process (photosynthesis)?
- Link to the result — connect the process change to the observable outcome (iodine colour)
Tip 12: State the Full Causal Chain (Never Skip Steps)
- Model answer: ‘The black strip blocks out light, so the covered part cannot photosynthesise, therefore no starch is produced, so the iodine will not turn blue-black’
- Each bold phrase is a potential mark-earning keyword
Tip 13: Key Scoring Keywords for Photosynthesis/Starch Questions
- ‘blocks out light’
- ‘cannot photosynthesise’
- ‘starch is not produced’
- ‘iodine will not detect starch’ / ‘iodine remains brown’
Tip 14: Name the Variable as ‘Presence/Absence of Light’
- Instead of: ‘The black strip is the variable’
- Say: ‘The variable is the presence or absence of light’
- Mark gain: Naming the correct scientific variable earns marks; naming the apparatus does not
Tip 15: Use a 4-step structure for experiment-comparison questions
When asked to compare two setups (e.g., tank with fish vs. tank without fish):
- State the difference: ‘Tank A has fish; Tank B does not.’
- Name the biological process: ‘The fish respire…’
- Trace the chain of effects: ‘…releasing carbon dioxide into the water, which increases the CO2 available to the plant, so the plant photosynthesizes at a faster rate…’
- Conclude with the outcome: ‘…therefore the plant in Tank A produces more food and grows bigger.’
- Mark gain: Each step in the chain earns a mark — a complete chain answer scores full marks.
Tip 16: Always write ‘respire’ not just ‘release CO2’
- Instead of: ‘Fish release carbon dioxide into the water’
- Say: ‘Fish respire and release carbon dioxide into the water’
- Mark gain: The word ‘respire’ explicitly demonstrates understanding of the cellular process and is required for full credit in experiment-type questions.
Quick Summary
The Big Picture
- Sun → Plants → Animals → Energy Used → Heat Lost
- The Sun provides light energy
- Plants convert light → chemical energy (photosynthesis)
- Animals eat plants/animals to get chemical energy
- All living things release energy from food (respiration)
- Energy decreases through each level of a food chain
Key Equations
- Photosynthesis: Light + H₂O + CO₂ → Food + O₂
- Respiration: Food + O₂ → Energy + CO₂ + H₂O
Energy Facts
- Only ~10% of energy transfers between food chain levels
- Fats store more energy than carbohydrates
- The Sun is the ultimate source of energy for life
- Energy is needed for all life processes (MRS GREN)
- Respiration happens in all cells all the time
Food Chain Terminology
- Producers: Plants (make food)
- Primary Consumers: Herbivores (eat plants)
- Secondary Consumers: Carnivores (eat herbivores)
- Tertiary Consumers: Top predators (eat other carnivores)
Energy Flow Path
SUN (light energy)
  ↓
PLANTS (photosynthesis: light → chemical energy)
  ↓
HERBIVORES (eat plants: gain ~10% of plant energy)
  ↓
CARNIVORES (eat herbivores: gain ~10% of herbivore energy)
Remember for Exams
- Use proper terminology: “chemical energy,” “photosynthesis,” “respiration”
- Explain energy conversions, not just energy flow
- Complete all equations with all products
- Name specific MRS GREN processes when asked about life processes
- Explain WHY energy decreases at each level, not just that it does
- Connect the Sun → Food → Living Things → Energy Used
Good luck with your PSLE Science exam, Jamie! Master this topic and you’ll ace the energy section.
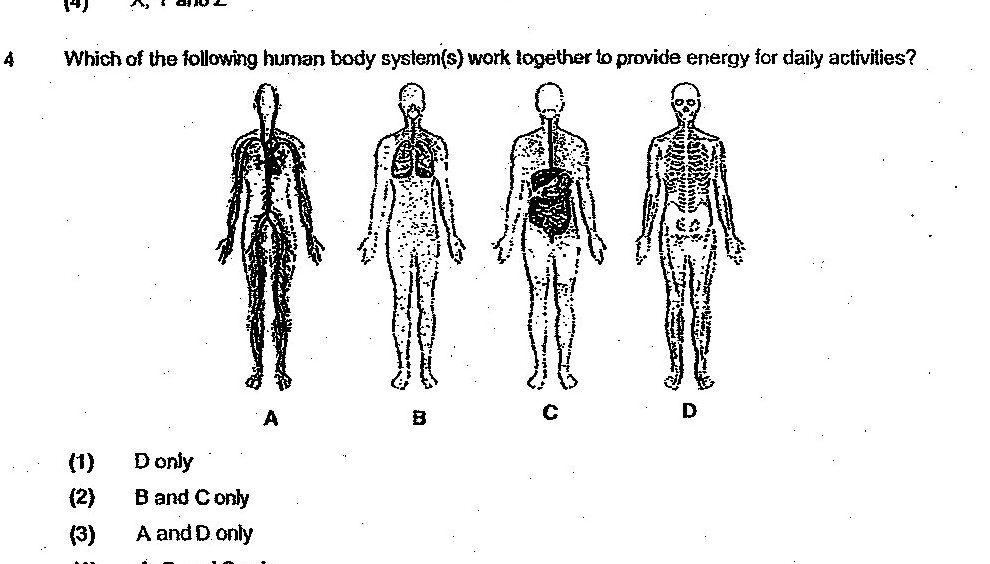
Which of the following human body system(s) work together to provide energy for daily activities?
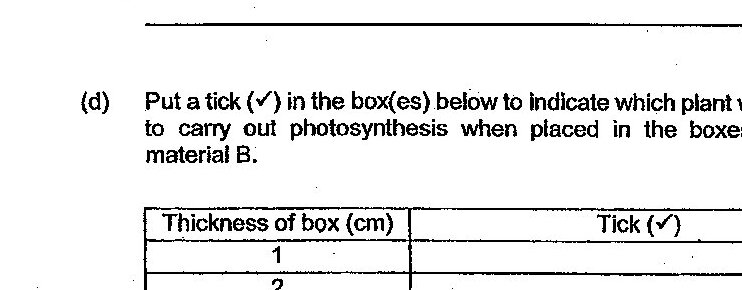
Put a tick (✓) in the box(es) below to indicate which plant was unable to carry out photosynthesis when placed in the boxes made of material B.
When the plant is exposed to light, what substances will it produce?
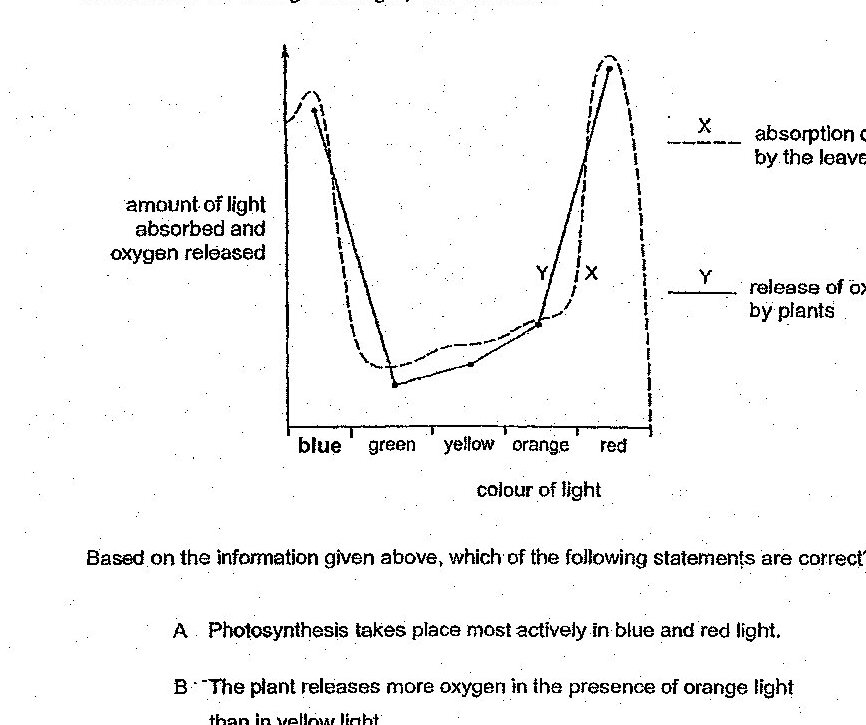
Raju conducted an experiment to investigate the effect of different coloured lights on a process taking place in green plants. He recorded his findings in the graph shown below. Based on the information given above, which of the following statements are correct?
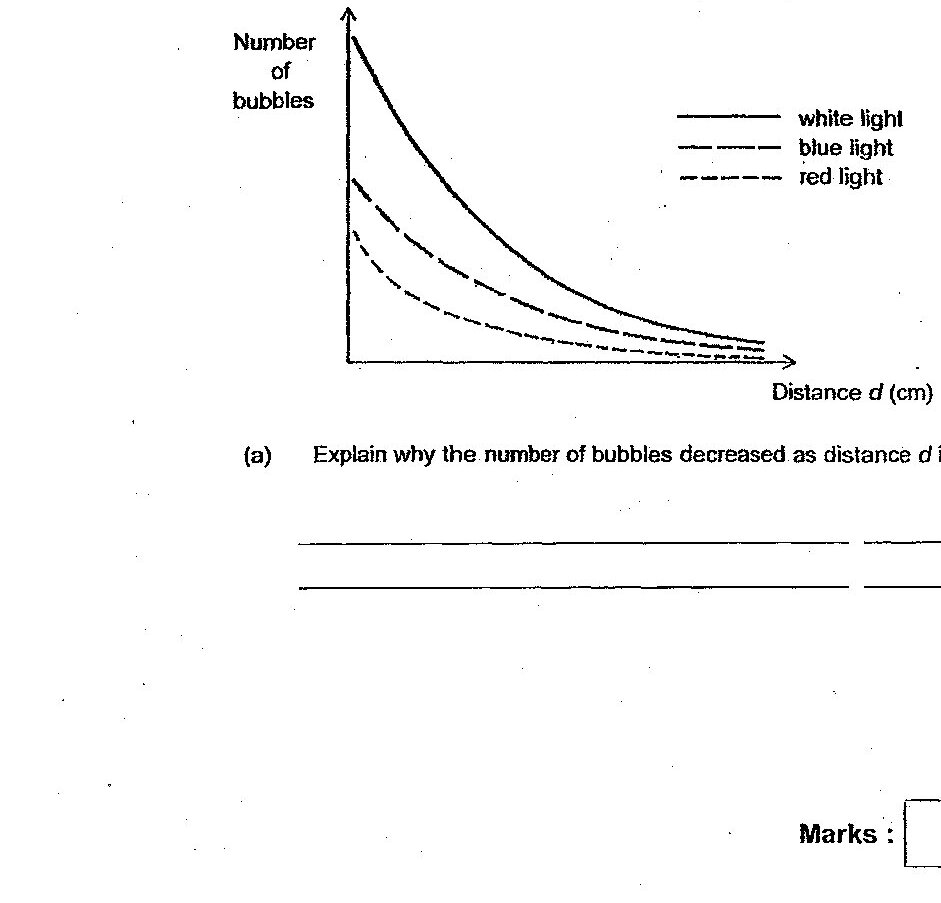
Tom wanted to investigate the effect of the intensity of different coloured lights on the rate of photosynthesis. The experiment was set up as shown below. He measured the number of bubbles given out at different distances. He repeated the experiment using blue and red light. The results are shown in the graph below. (a) Explain why the number of bubbles decreased as distance d increased.
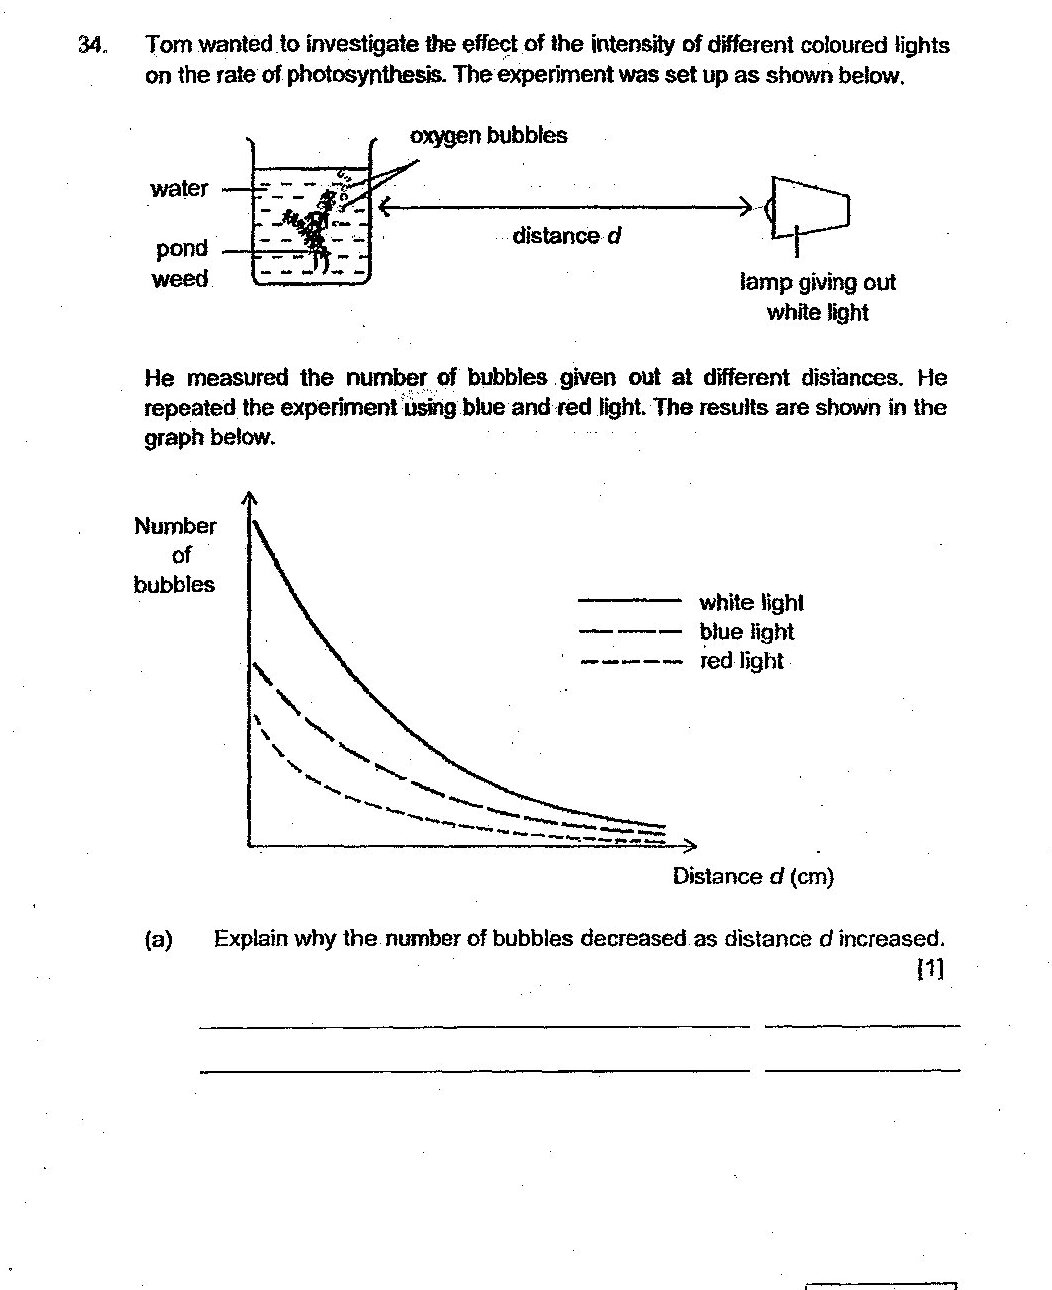
Tom had some fishes and pond weeds in his aquarium at home. Based on the results, which coloured light was most suitable for the survival of the fishes? Explain your answer.
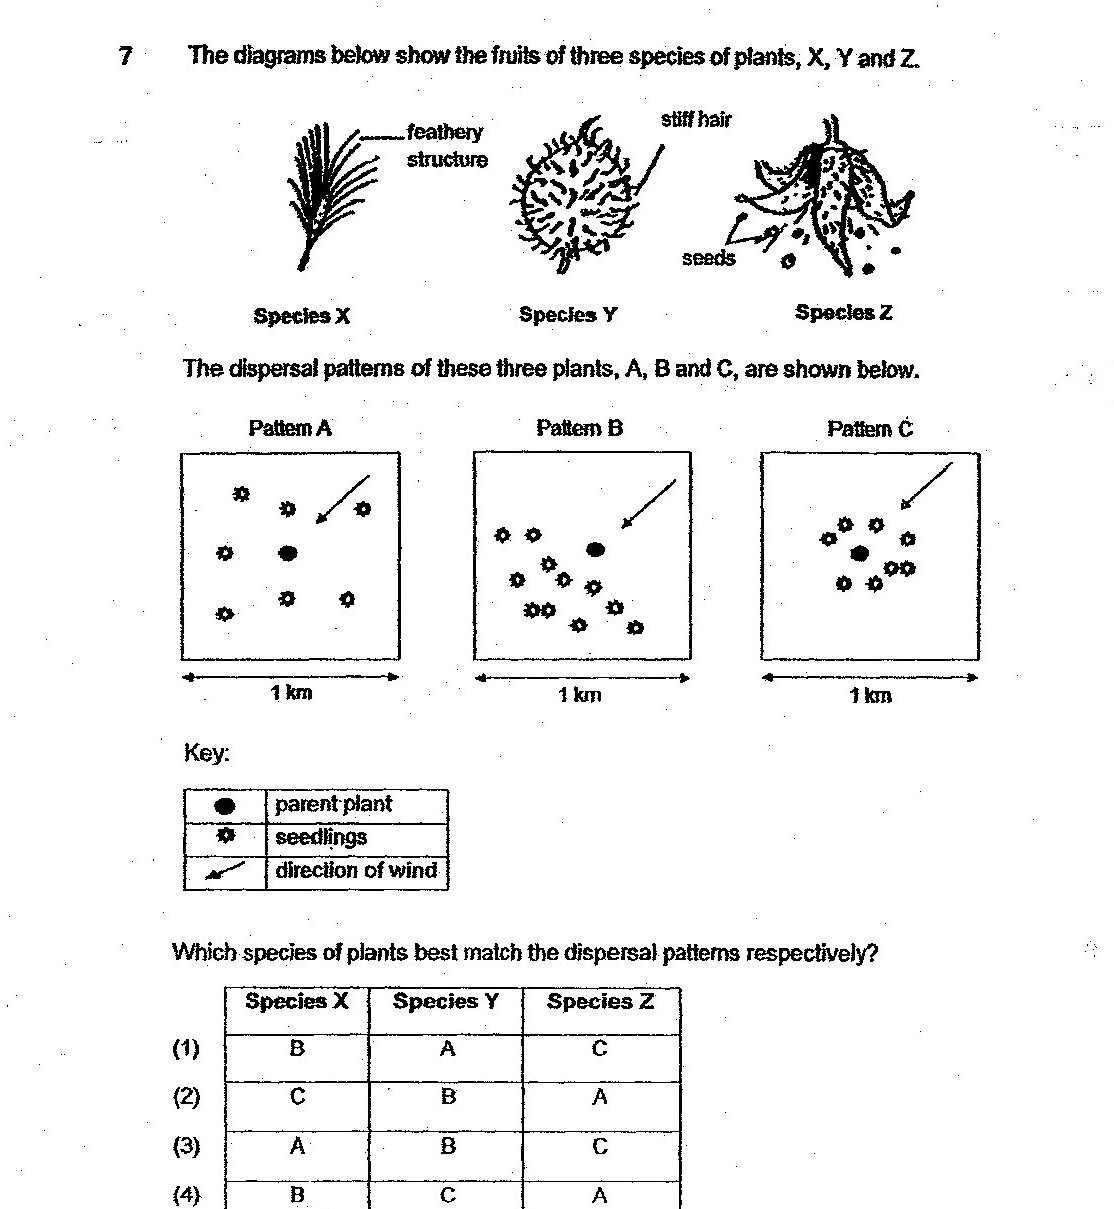
Which species of plants best match the dispersal patterns respectively?
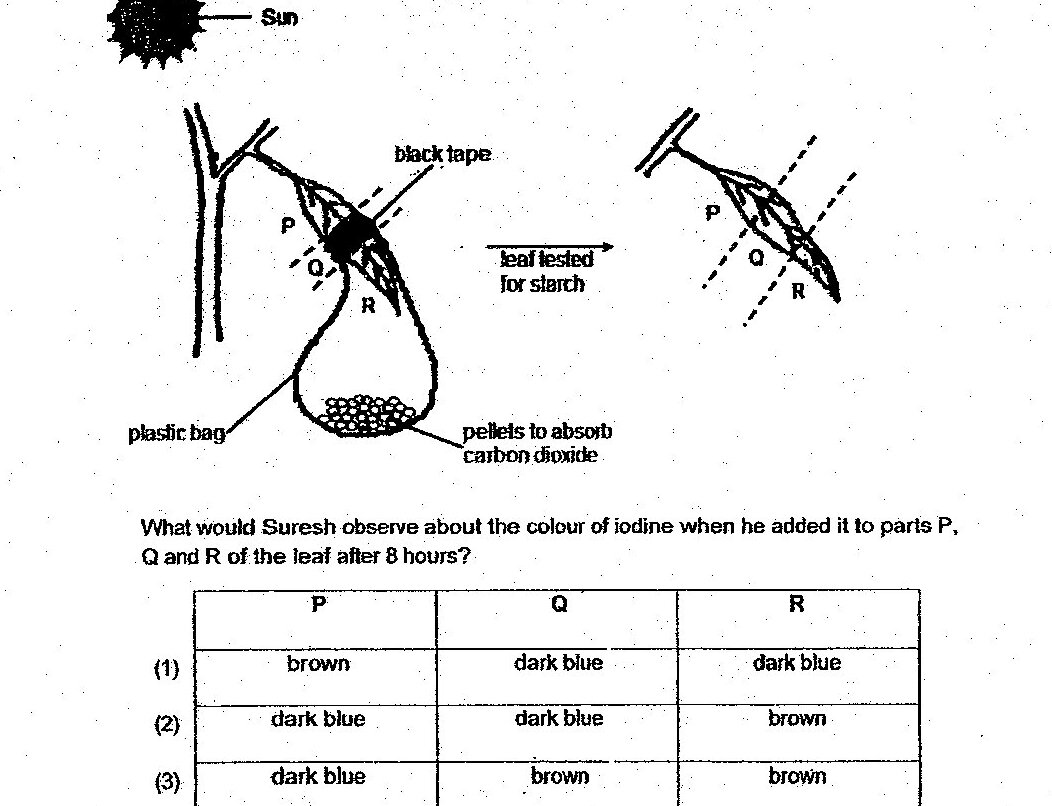
Suresh prepared the set-up below and left it under the sun for 8 hours. Then he tested the leaf for the presence of starch using iodine solution. What would Suresh observe about the colour of iodine when he added it to parts P, Q and R of the leaf after 8 hours?
The plants given the liquid from the composter will grow healthier than the plants given tap water. Explain why.
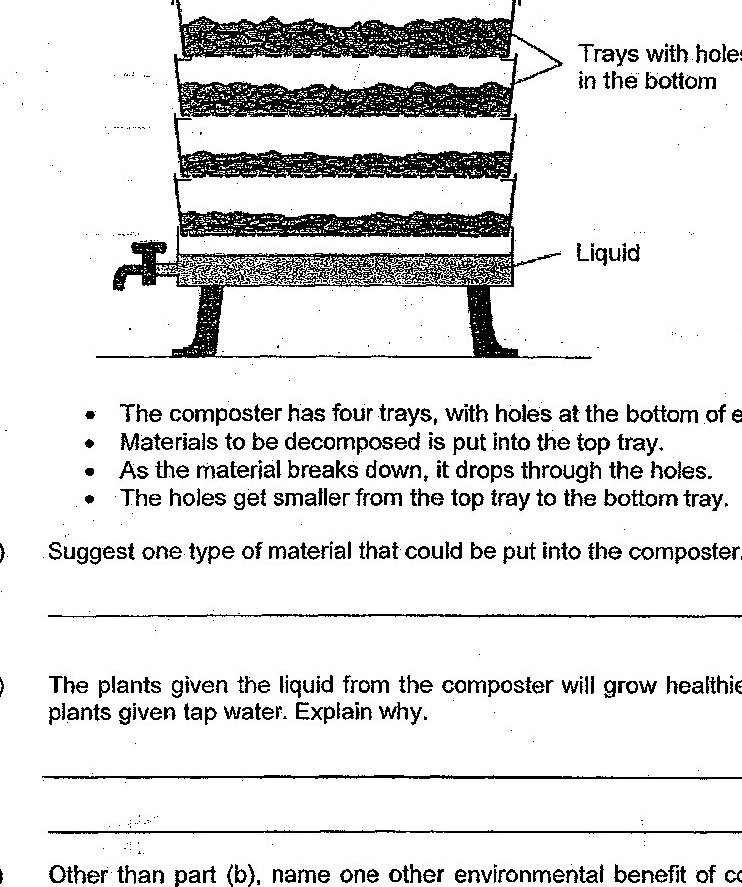
Other than part (b), name one other environmental benefit of composting. Explain your answer.
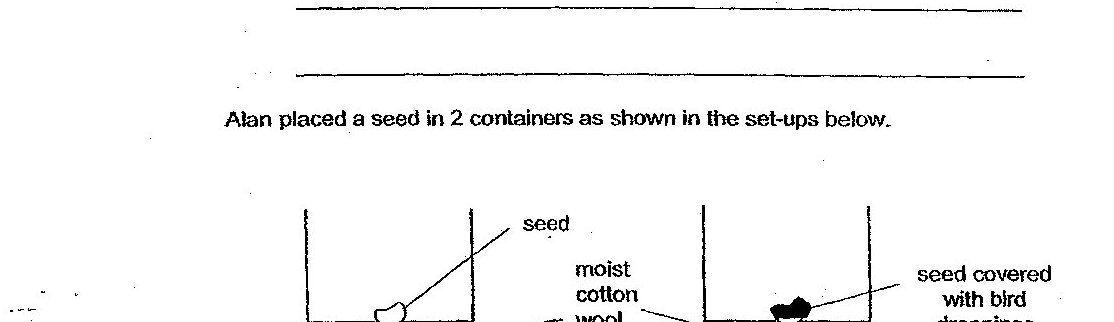
He noticed that the seeds in both setups could germinate. Explain why they were able to germinate.
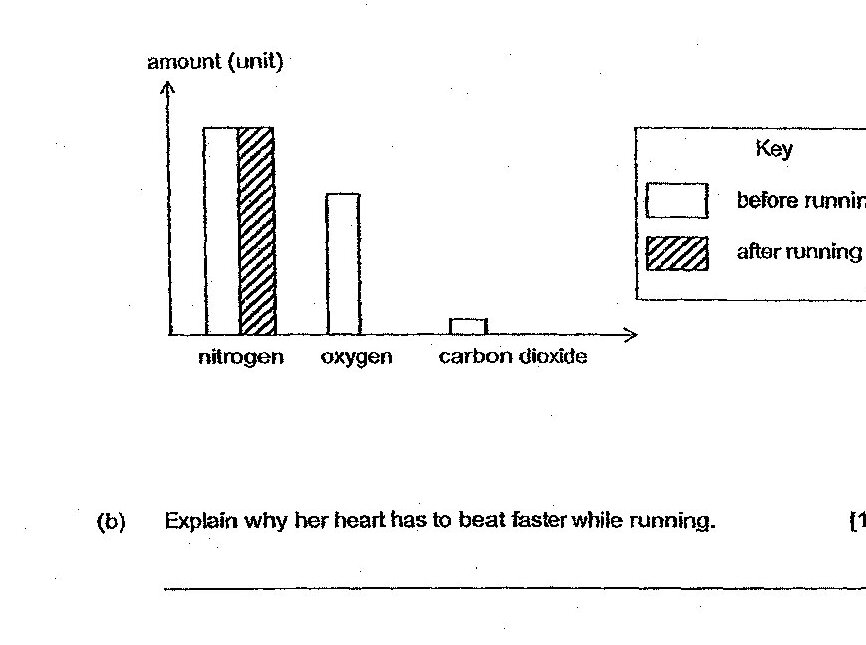
Draw the bar graphs to show the amount of oxygen and carbon dioxide in the paper bag after two minutes, based on the key provided. The results for nitrogen has been drawn for you.
Which of the following two activities contribute to an increase in the amount of carbon dioxide in the air?
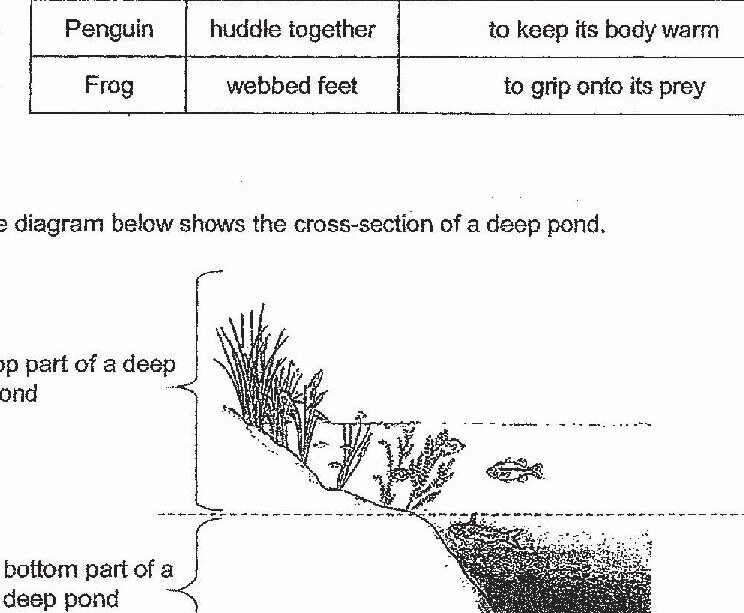
The diagram below shows the cross-section of a deep pond. There are more aquatic plants found at the top part of the deep pond. What is the main reason for such an observation?
Deforestation can also lead to global warming. Explain why.
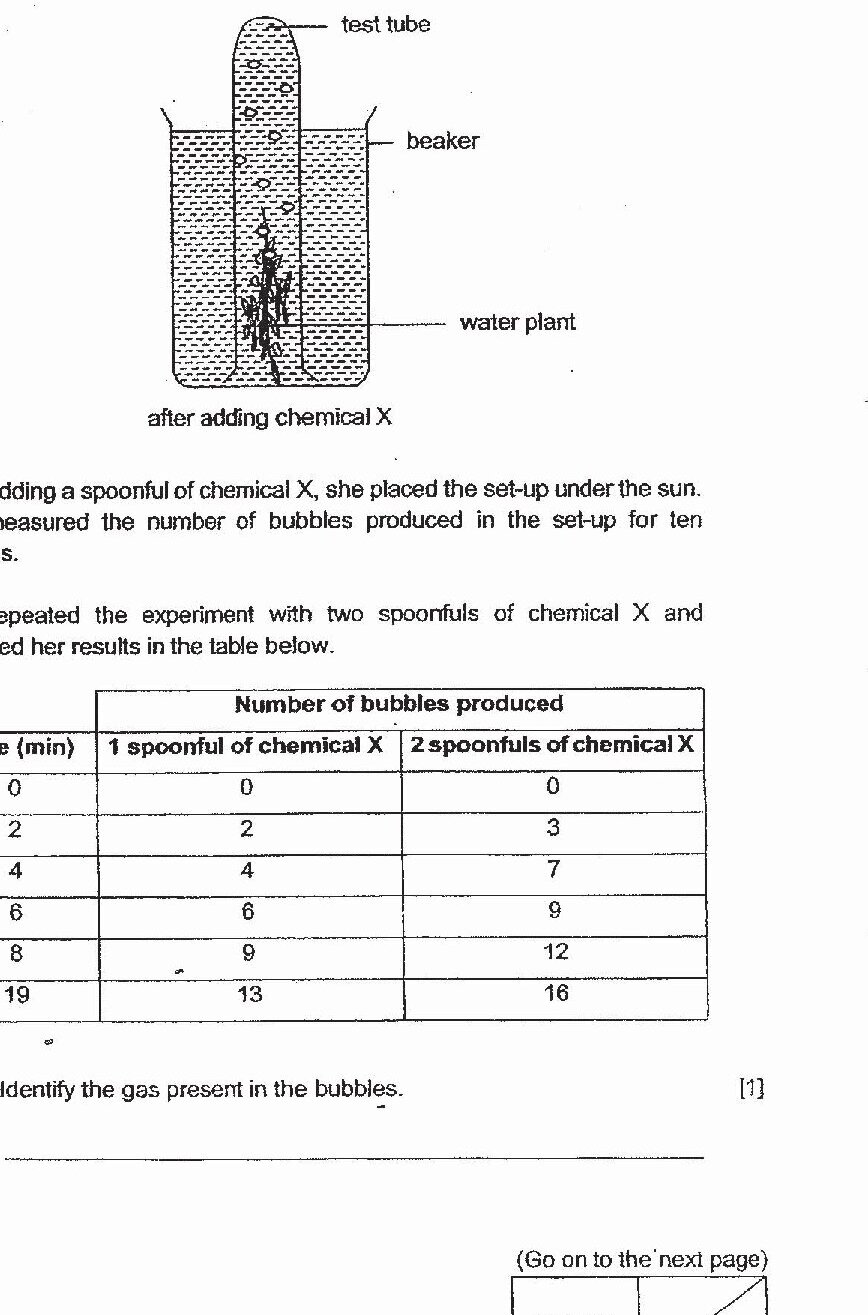
Based on the experiment, what is the effect of the amount of chemical X on the rate of photosynthesis?
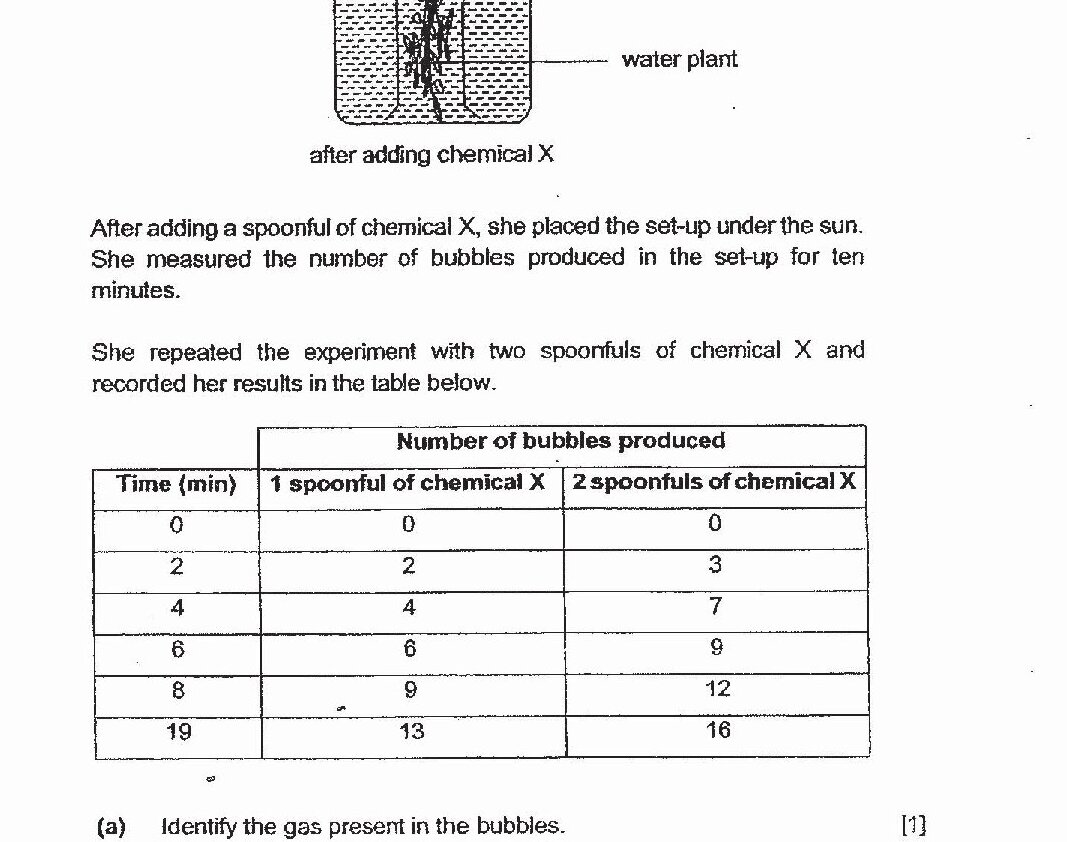
Give a reason why Meili filled the test tube completely with water at the start of the experiment.
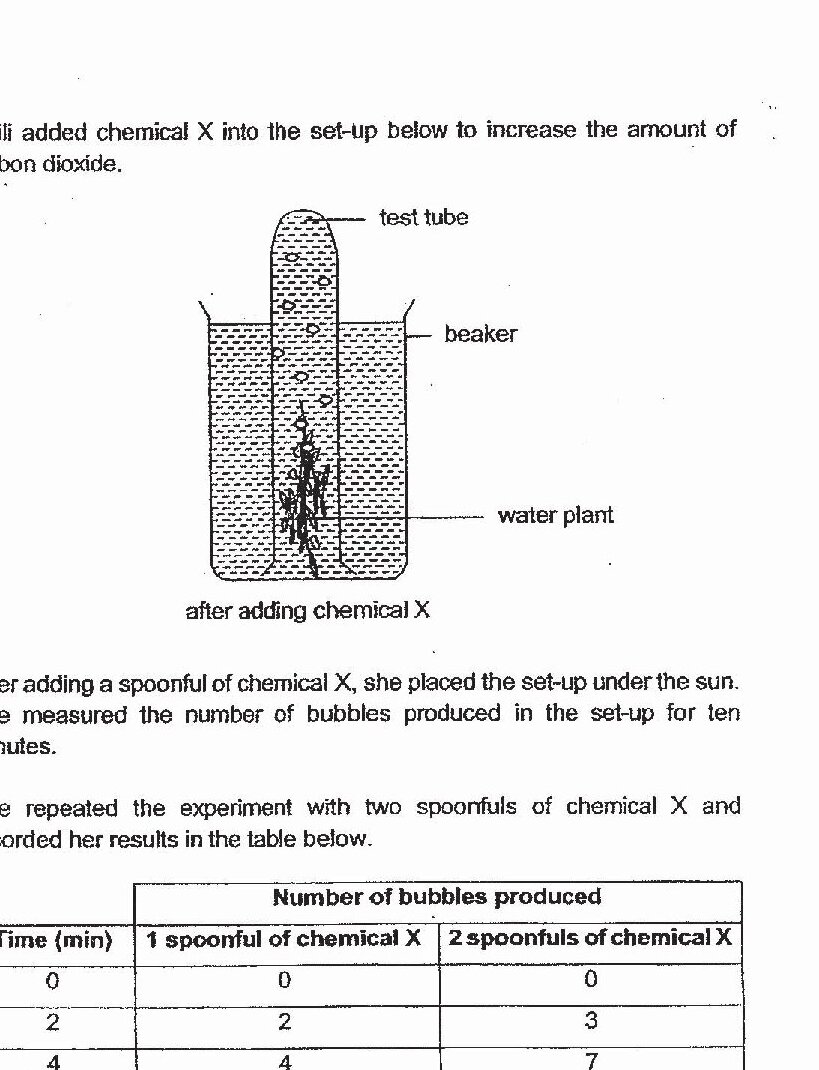
Suggest a control set-up to show that the increase in the number of bubbles was caused by chemical X.
Which of the following activities help to keep the environment clean and green?
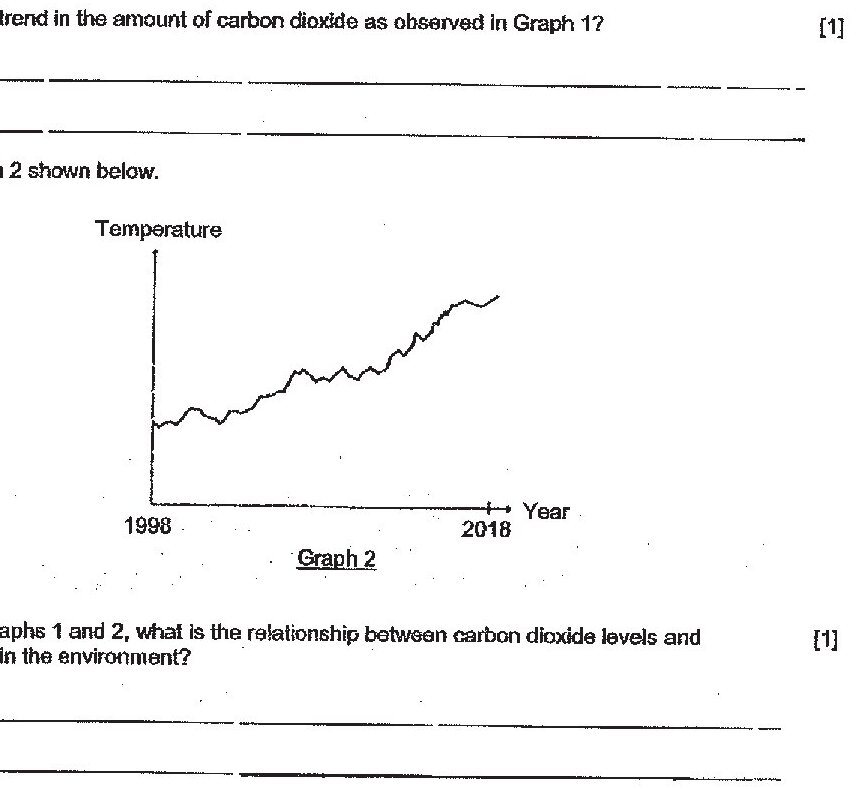
Based on Graphs 1 and 2, what is the relationship between carbon dioxide levels and temperature in the environment?
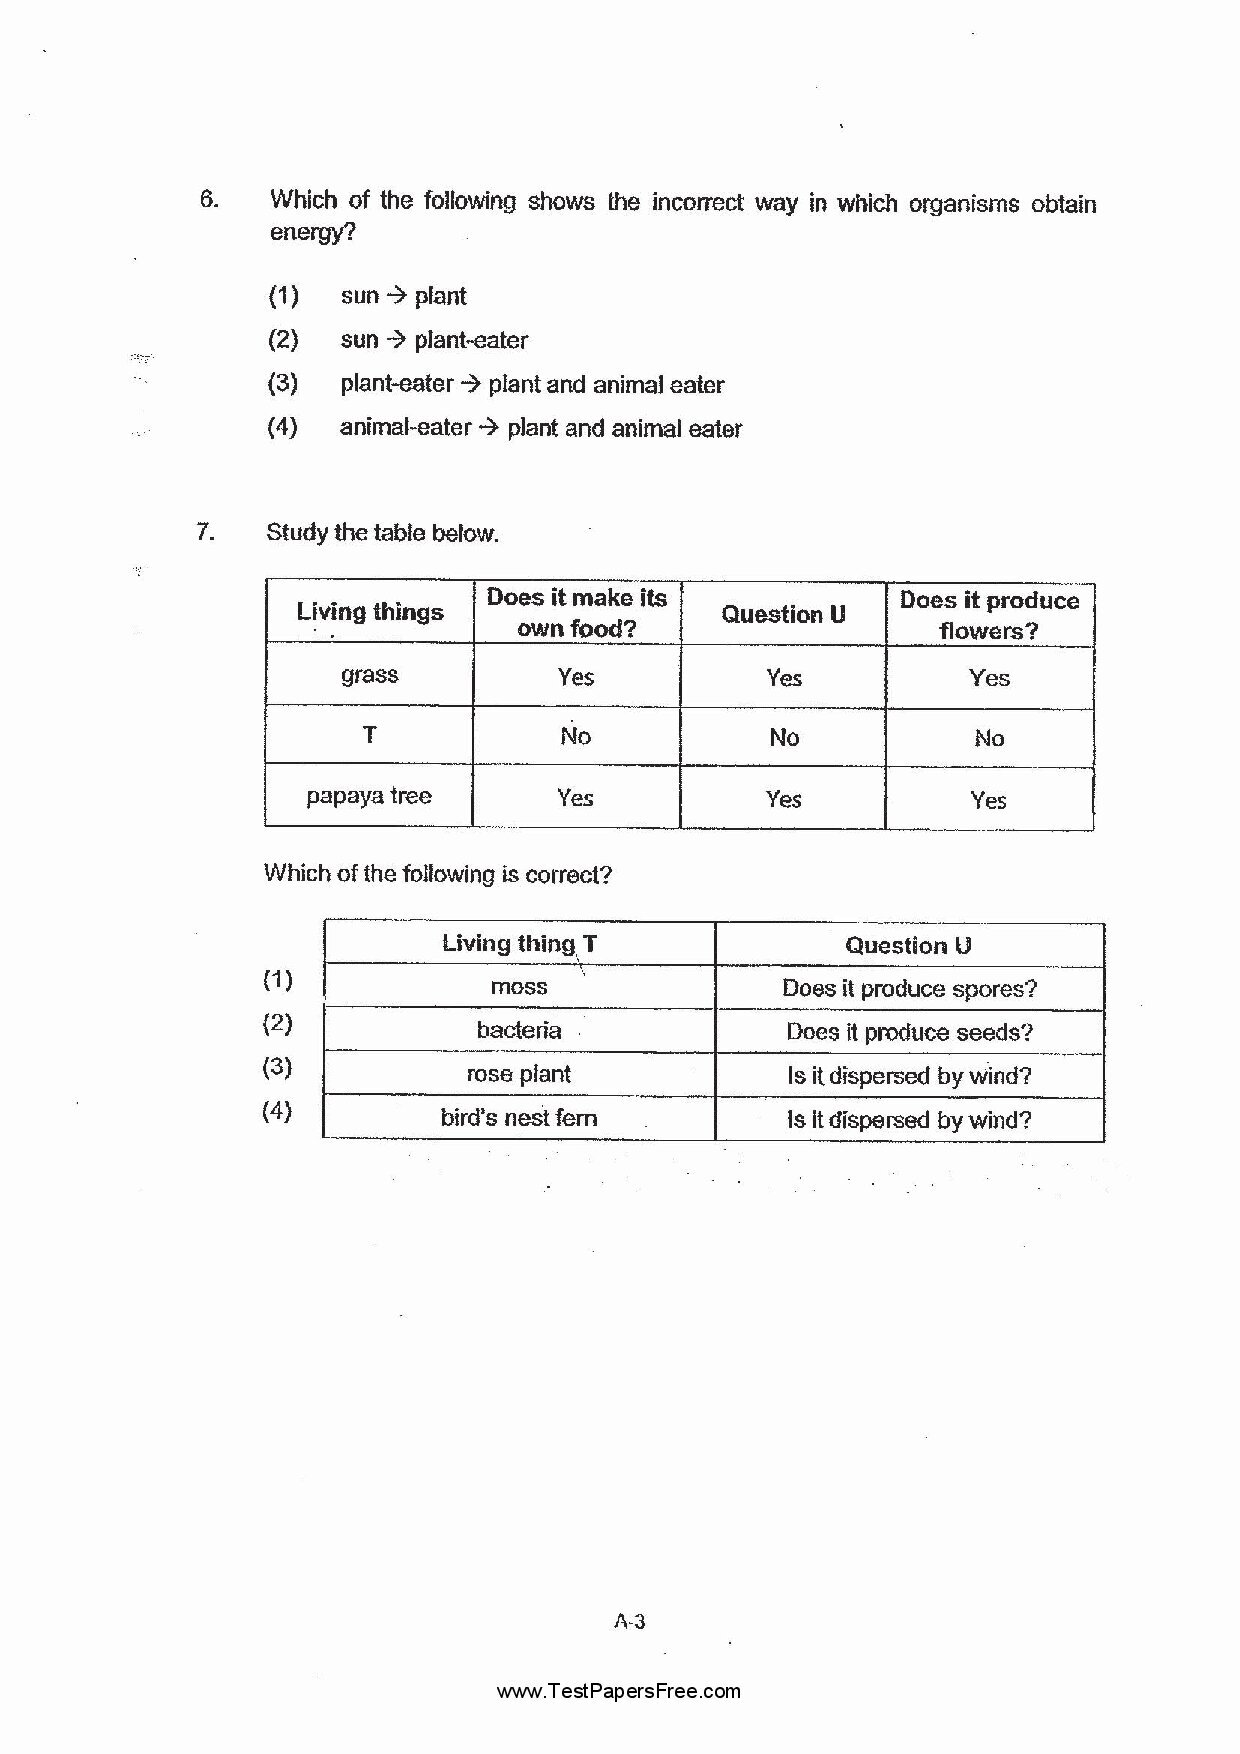
Which of the following shows the incorrect way in which organisms obtain energy?
Fill in the boxes to list the requirements and products of photosynthesis
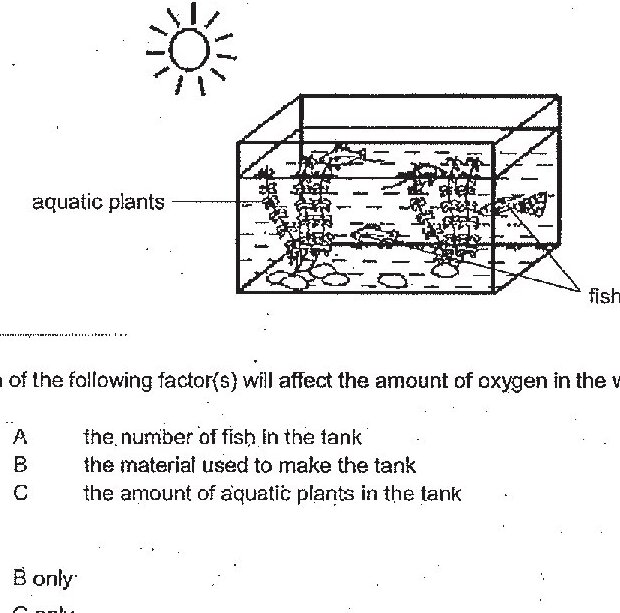
A tank containing some aquatic plants and fish is placed in the garden on a sunny day. Which of the following factor(s) will affect the amount of oxygen in the water?
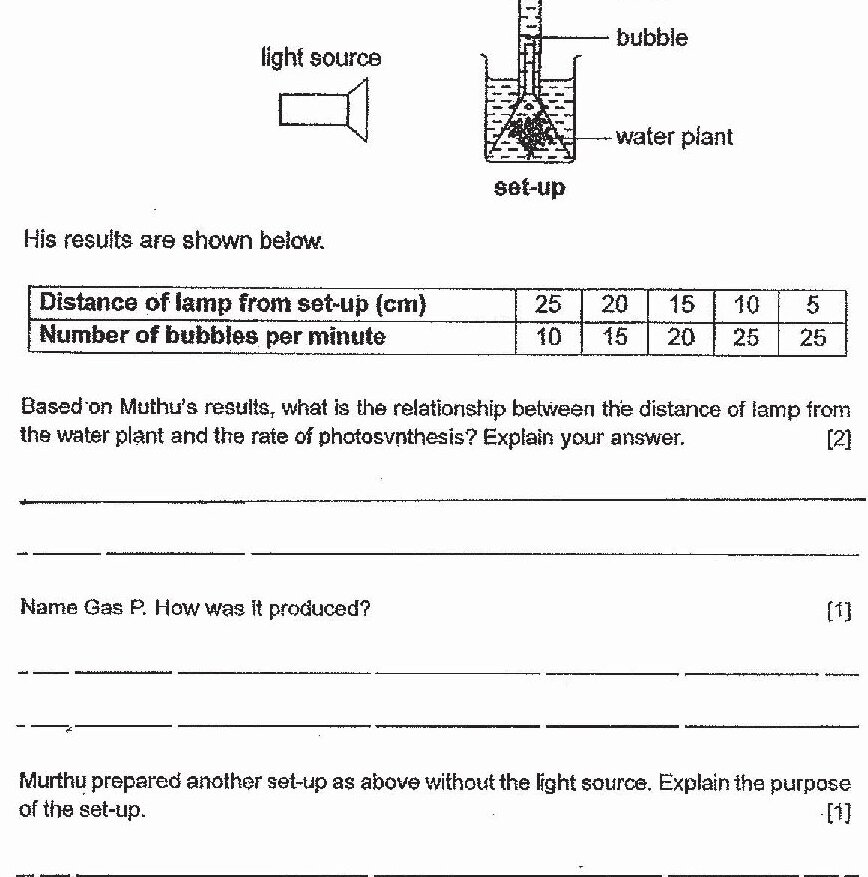
Based on Muthu's results, what is the relationship between the distance of lamp from the water plant and the rate of photosynthesis? Explain your answer.
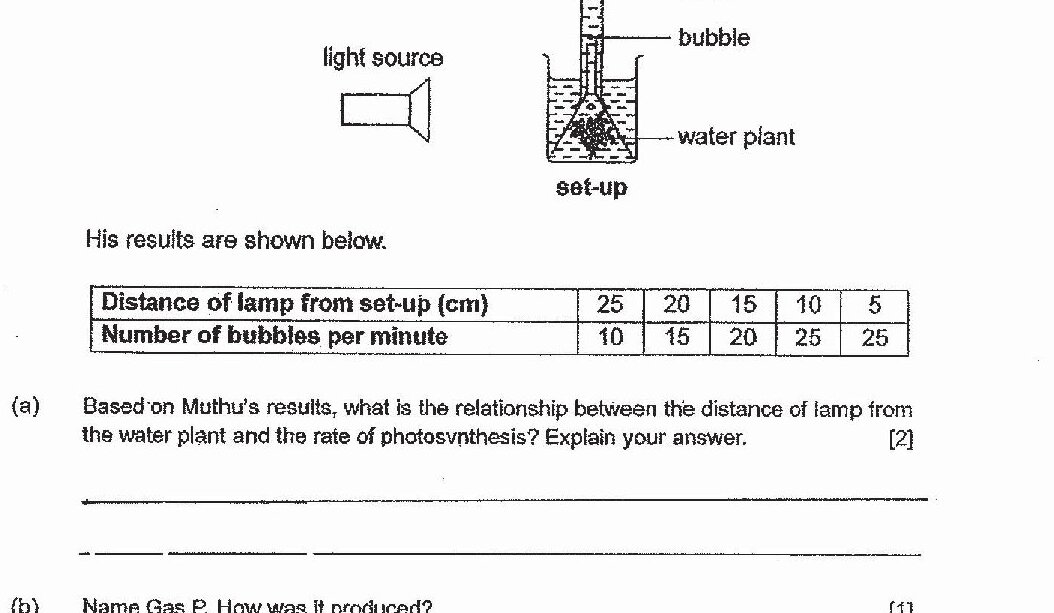
Muthu prepared another set-up as above without the light source. Explain the purpose of the set-up.
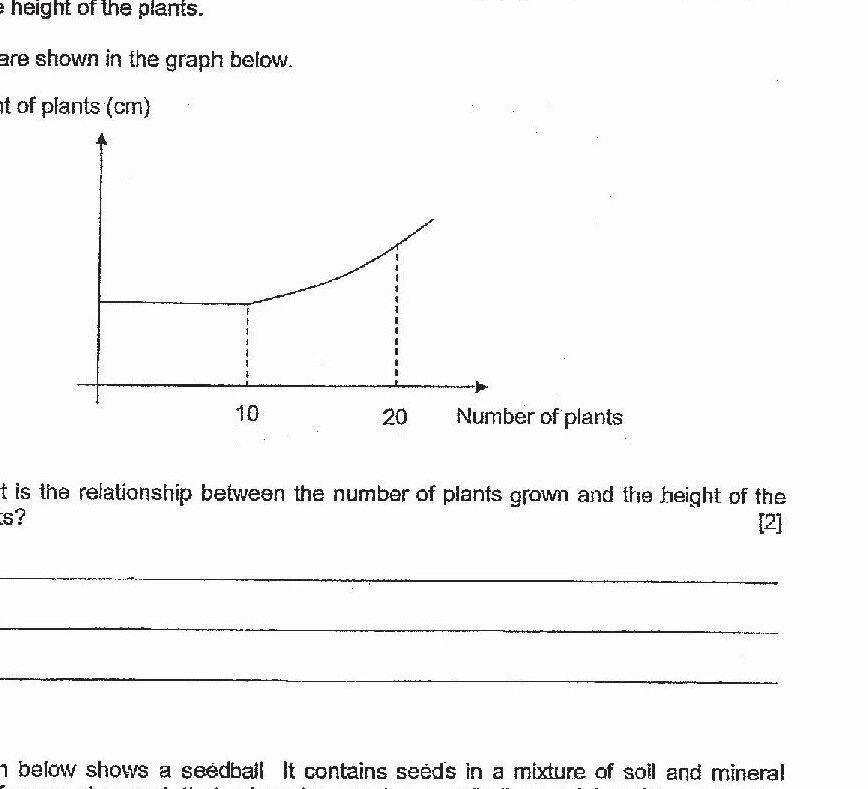
What is the relationship between the number of plants grown and the height of the plants?
Draw a diagram using arrows to show how energy from the Sun is passed on to Joel.
Give a reason why Joel does not get all the energy that the plant obtained from the Sun.
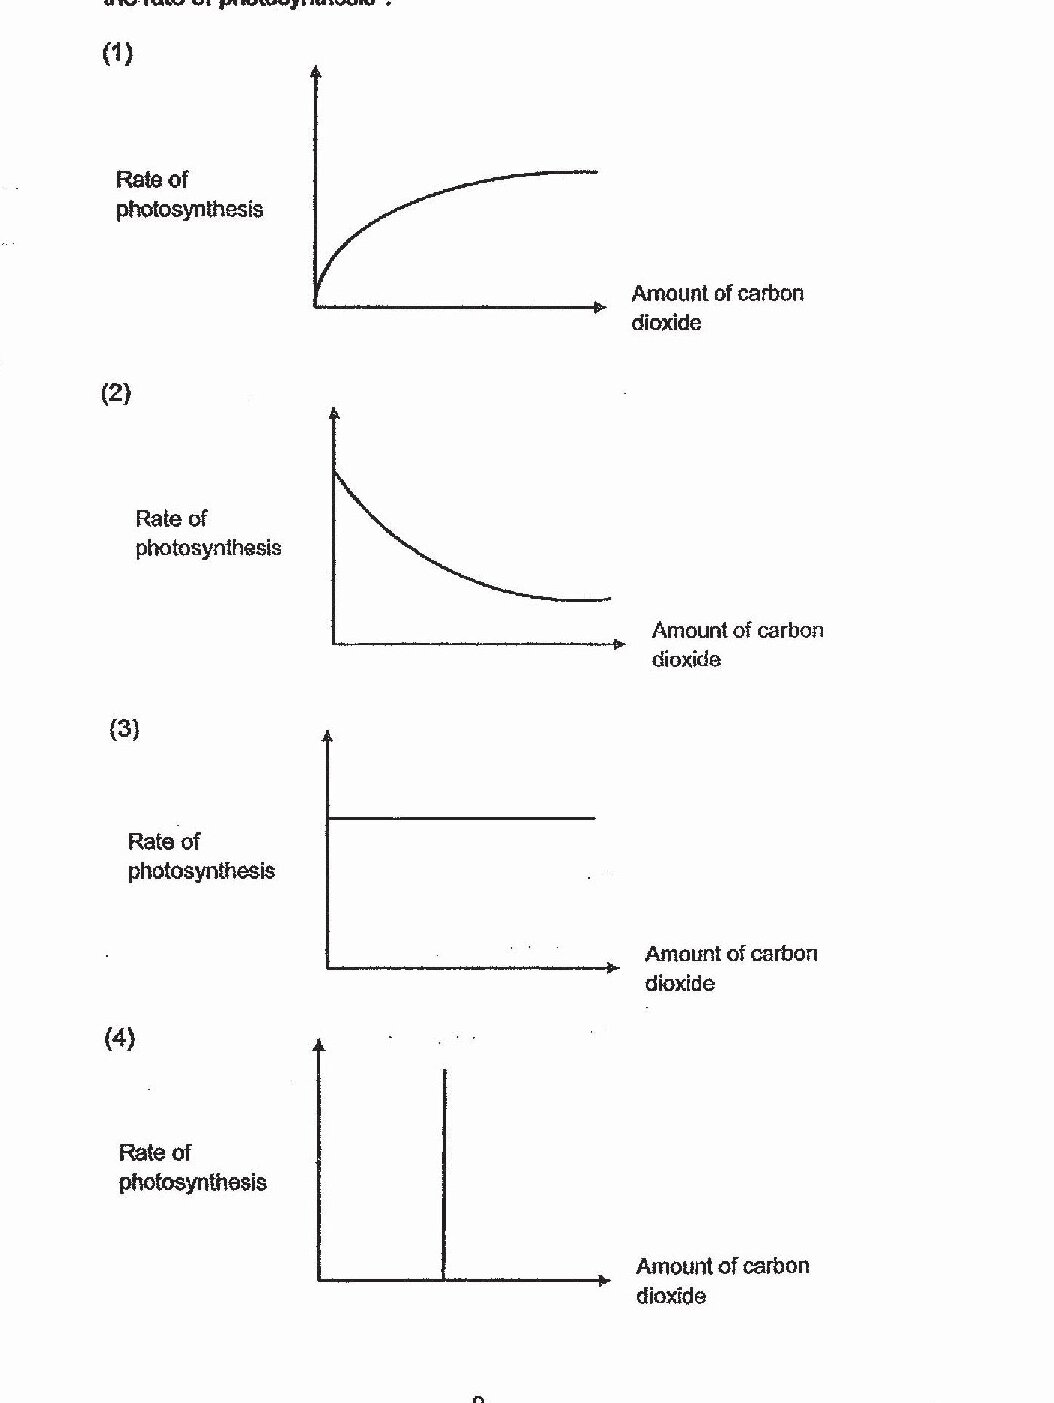
Which one of the following graphs correctly shows how carbon dioxide affects the rate of photosynthesis?
Past year papers cover the full exam — browse by subject below.
View All Papers ›