Sources of Energy
Sources of Energy
Key Concepts
Energy is essential for all living things and modern life. We use energy for heating, lighting, cooking, transportation, and powering machines. Energy comes from different sources, which can be classified into two main types: renewable energy sources and non-renewable energy sources.
What is Energy?
Energy is the ability to do work or cause change. It can be used to heat things, move things, or produce light.
Types of Energy Sources
Energy sources are classified based on whether they can be replaced naturally or not:
- Renewable Energy Sources — Can be naturally replaced or replenished quickly
- Non-Renewable Energy Sources — Cannot be quickly replaced and will eventually run out
Renewable Energy Sources
Renewable energy sources are energy sources that can be naturally replenished and will not run out (or take many thousands of years to run out).
1. Solar Energy
Definition: Energy from the sun’s heat and light.
How it works:
- Solar panels (also called photovoltaic cells or PV cells) convert sunlight directly into electricity
- Solar heaters use the sun’s heat to warm water for bathing or heating
Examples:
- Solar panels on HDB rooftops in Singapore
- Solar-powered calculators
- Solar heaters in homes and hotels
Advantages:
- Freely available and inexhaustible (the sun will last for billions of years)
- Does not produce pollution or greenhouse gases
- Low operating costs once installed
- Suitable for sunny countries like Singapore
Disadvantages:
- Dependent on weather (cloudy days produce less energy)
- High initial installation cost
- Requires large space for panels to generate significant energy
2. Wind Energy
Definition: Energy from the wind, which is harnessed using wind turbines to generate electricity.
How it works:
- Wind turbines have large blades that rotate when wind blows
- The rotating blades turn a generator that produces electricity
- Wind farms consist of multiple turbines in windy areas
Examples:
- Wind farms in coastal areas
- Wind turbines on hills and open plains
- Windmills (traditional use)
Advantages:
- Free and inexhaustible source of energy
- Does not produce pollution
- Relatively quick to set up compared to fossil fuel power stations
- Can generate large amounts of electricity
Disadvantages:
- Dependent on wind speed and direction
- Wind farms take up large areas of land
- Can be noisy
- May affect bird populations
- Requires windy locations to be effective
3. Hydroelectric Energy (Water Energy)
Definition: Energy obtained from flowing or falling water, used to generate electricity.
How it works:
- Water from dams or rivers flows down through turbines
- The flowing water turns the turbines, which rotate a generator
- The faster the water flows or the greater the height of the fall, the more electricity is generated
Examples:
- Dams with hydroelectric power stations
- Waterfalls converted to generate power
- Tidal barrages that use ocean tides
Advantages:
- Renewable and reliable source of energy
- No air pollution
- Dams can also be used for water supply and flood control
- Long lifespan of power stations
Disadvantages:
- Requires specific geographical features (rivers, mountains, rainfall)
- Building dams is very expensive and takes years
- Can disrupt ecosystems and affect fish migration
- Dependent on rainfall levels (droughts reduce water availability)
4. Geothermal Energy
Definition: Energy from the heat inside the Earth.
How it works:
- Hot rocks and steam trapped deep underground heat water
- This steam and hot water are piped to the surface
- The steam drives turbines to generate electricity
- The hot water can also be used directly for heating
Examples:
- Geothermal power stations in volcanic regions (New Zealand, Iceland, Philippines)
- Geothermal heating systems in some countries
Advantages:
- Reliable and consistent (not dependent on weather)
- No air pollution
- Renewable source with minimal environmental impact
- Can provide both electricity and heating
Disadvantages:
- Only available in certain geographical locations (near volcanic areas)
- High drilling and installation costs
- Limited availability outside geologically active regions
- Singapore does not have this resource
5. Biomass Energy
Definition: Energy from organic materials (plant and animal waste) that can be burned or converted into biofuel.
How it works:
- Biomass includes wood, agricultural waste, food scraps, and other organic materials
- Biomass can be burned directly to produce heat
- Biomass can be converted into biofuels (bioethanol, biodiesel) that power vehicles
- Decomposing biomass produces biogas which can generate electricity
Examples:
- Burning wood for heating and cooking
- Using agricultural waste and dung as fuel
- Bioethanol fuel for vehicles
- Biogas from decomposing waste in landfills
- Methane from animal manure
Advantages:
- Uses waste materials that would otherwise be discarded
- Renewable if sustainably harvested
- Less dependent on fossil fuels
- Can reduce waste in landfills
Disadvantages:
- Still produces air pollution when burned
- Takes time to grow or accumulate sufficient biomass
- Large land areas needed to produce significant amounts
- Can compete with food production for land
Non-Renewable Energy Sources
Non-renewable energy sources are finite resources that cannot be quickly replaced. Once used up, they take millions of years to form naturally. These are called fossil fuels.
What are Fossil Fuels?
Fossil fuels are energy sources that formed from the remains of dead plants and animals buried deep underground for millions of years under pressure and heat.
The three main fossil fuels are:
6. Coal
What it is:
- A black or dark brown solid fuel
- Formed from the remains of ancient plants (from forests that existed millions of years ago)
- Millions of years of pressure and heat compressed these plants into coal
Uses:
- Burned in power stations to generate electricity
- Used in some industries for heating and processing
- Historically used for heating homes (now less common)
Advantages:
- Abundant supply (still plenty left)
- Relatively cheap
- Existing coal power stations are established
Disadvantages:
- Burns to produce air pollution
- Releases greenhouse gases (CO₂) contributing to climate change
- Coal mining can damage landscapes and ecosystems
- Health problems from air pollution
7. Oil (Petroleum)
What it is:
- A thick, dark liquid fuel
- Formed from the remains of dead sea plants and animals
- Trapped under ground and sea, compressed over millions of years
Uses:
- Refined into petrol for cars and vehicles
- Refined into diesel for trucks and ships
- Used for heating oil in some homes
- Source of many plastics and chemicals
- Burning in power stations to generate electricity
Advantages:
- High energy content (provides lots of energy per unit)
- Easy to transport and store
- Convenient to use
Disadvantages:
- Oil spills cause severe environmental damage
- Burning releases greenhouse gases
- Finite supply will run out
- Oil extraction affects ecosystems
8. Natural Gas
What it is:
- An invisible, odourless gas
- Formed from the remains of sea organisms buried underground
- Often found alongside oil deposits
- A colourless, odourless gas (additives give it a distinctive smell for safety)
Uses:
- Heating homes and buildings
- Cooking in kitchens
- Generating electricity in power stations
- Industrial processes
- Some vehicles use compressed natural gas (CNG)
Advantages:
- Cleaner burning than coal or oil
- Abundant supply
- Efficient for heating
- Less air pollution than coal
Disadvantages:
- Still a fossil fuel (produces CO₂)
- Methane leaks during extraction and transport (potent greenhouse gas)
- Finite supply will eventually run out
- Dependent on established pipelines
How Fossil Fuels Formed
Timeline of fossil fuel formation:
- Long ago (300-400 million years ago): Ancient forests and sea organisms lived and died
- Burial: Dead plants and animals were buried under layers of sediment (sand, mud, clay)
- Pressure and Heat: Over millions of years, the weight of overlying rock layers created immense pressure, and temperatures deep underground increased
- Chemical Change: Under these extreme conditions, the organic material was transformed through chemical reactions into coal, oil, and natural gas
- Trapped: These fuels remained trapped underground in rock layers
This process takes millions of years, so fossil fuels are considered “ancient energy” from prehistory.
Why Fossil Fuels Will Run Out
Finite Resources
Fossil fuels are non-renewable resources. They are formed over millions of years, but we are using them at a much faster rate than they are being formed. Eventually, they will run out.
Why this matters:
- Coal reserves may last for a few hundred years at current usage rates
- Oil reserves may be depleted within 50-100 years
- Natural gas reserves may last for 50-200 years, depending on usage
Predictions:
- “Peak oil” may occur within this century (when we’ve extracted and used half of all available oil)
- As reserves become depleted, extraction becomes more difficult and expensive
- Energy costs will rise significantly
Environmental Concerns
We cannot wait for fossil fuels to naturally run out because burning them damages the environment NOW.
Environmental Impact of Fossil Fuels
9. Air Pollution
What happens when fossil fuels burn:
- Sulfur dioxide (SO₂) is released → causes acid rain
- Nitrogen oxides (NOₓ) are released → causes smog and breathing problems
- Particulates and soot are released → causes respiratory diseases
- Carbon monoxide is released → toxic and affects oxygen transport in blood
Health effects:
- Asthma and respiratory diseases
- Heart disease and stroke
- Premature death, especially in children and elderly people
- Reduced air quality in cities with heavy traffic and industry
Singapore’s context:
- Singapore experiences haze from neighboring countries’ burning of palm oil fields (biomass burning)
- Air Quality Index (AQI) measures pollution levels (Singapore PSI in the past)
- Air pollution affects public health, especially on hazy days
10. Greenhouse Effect and Climate Change
What causes the greenhouse effect:
- When fossil fuels burn, they release carbon dioxide (CO₂)
- CO₂ and other greenhouse gases (methane, nitrous oxide) trap heat in the atmosphere
- These gases act like a blanket, preventing heat from escaping to space
- This causes global temperatures to rise
Greenhouse gases from fossil fuels:
- Carbon dioxide (CO₂) — from burning coal, oil, and natural gas
- Methane (CH₄) — from coal mines, oil wells, and natural gas leaks
- Nitrous oxide (N₂O) — from fuel combustion and industrial processes
Effects of climate change:
- Rising global temperatures
- Melting ice caps and glaciers → rising sea levels
- More extreme weather (stronger typhoons, floods, droughts)
- Threats to coastal cities and small island nations
- Disruption to ecosystems and species extinction
Why this is critical for Singapore:
- Singapore is a low-lying island nation vulnerable to rising sea levels
- Climate change threatens food security and water supply
- Extreme weather affects agriculture and water resources in Southeast Asia
- Coral bleaching affects marine ecosystems
11. Oil Spills and Pollution
Environmental damage from oil:
- Oil spills from tankers or drilling accidents contaminate oceans
- Oil kills marine life and seabirds
- Oil slicks take years to clean up
- Persistent organic pollutants (POPs) accumulate in food chains
- Destruction of coastal habitats and fishing grounds
The Need for Energy Conservation and Renewable Energy
Why We Need to Switch to Renewable Energy
Environmental reasons:
- Stop greenhouse gas emissions that cause climate change
- Reduce air pollution affecting human health
- Protect ecosystems and biodiversity
Economic reasons:
- Fossil fuels are running out (economic scarcity)
- Renewable energy costs are dropping rapidly
- Long-term energy security without relying on finite resources
Social reasons:
- Ensure energy access for future generations
- Reduce dependence on fossil fuel imports (energy independence)
- Create jobs in renewable energy industries
Energy Conservation
Even as we switch to renewable energy, we must also reduce energy consumption. Energy conservation means using less energy through more efficient practices.
Energy Conservation at Home
-
Lighting:
- Use LED bulbs instead of incandescent or fluorescent bulbs (LEDs use 75% less energy)
- Turn off lights when leaving a room
- Use natural sunlight during the day
-
Heating and Cooling:
- Use air conditioning only when necessary
- Set temperatures to comfortable but not extreme levels (26-28°C is comfortable in Singapore)
- Close windows and doors when air conditioning is on
- Ensure proper insulation (draw curtains to block heat)
- Use fans instead of air conditioning when possible
-
Appliances:
- Choose energy-efficient appliances (look for Energy Guide labels)
- Use washing machines and dishwashers with full loads only
- Refrigerators should be at the back away from walls, not directly under sunlight
- Turn off appliances at the plug when not in use (standby power consumption)
-
Water Heating:
- Take shorter showers
- Use cold water for washing clothes when possible
- Insulate hot water pipes
-
Cooking:
- Use lids on pots to retain heat
- Use appropriate sized burners
- Thaw frozen food before cooking
- Microwave or oven cooking uses less energy than stovetop
Energy Conservation at School
-
Classroom practices:
- Turn off lights and fans when the classroom is empty
- Close windows when air conditioning is on
- Use natural ventilation when possible
-
General practices:
- Walk or cycle instead of using cars for short distances
- Use public transport (buses, MRT) for longer journeys
- Avoid unnecessary printing (go digital)
- Use both sides of paper
-
Responsible habits:
- Switch off computers after use (don’t leave in sleep mode)
- Turn off taps properly to avoid water waste (water requires energy to treat)
- Participate in school energy-saving initiatives
Singapore’s Energy Strategy: The Four Taps
Singapore, being a small island nation with limited natural resources, has developed a strategic approach to energy called The Four Taps of Energy:
12. Natural Gas
- Singapore imports natural gas from neighboring countries via pipelines
- Natural gas is cleaner than coal and oil
- Used in power stations to generate electricity
- Accounts for the largest share of Singapore’s electricity
13. Solar Energy (The Growth Tap)
- Singapore is expanding solar energy rapidly
- Solar panels installed on:
- HDB rooftops (Housing Development Board residential buildings)
- Industrial buildings
- Warehouses
- Target: Singapore aims to generate a significant portion of electricity from solar panels
- Challenges: Limited land area and frequent clouds reduce solar efficiency
14. Imported Electricity
- Singapore imports electricity from neighboring countries (Malaysia) via undersea cables
- Provides energy security through diversification
- Reduces dependence on single energy sources
15. Regional Power Markets and Emerging Technologies
- Participating in ASEAN power trading networks
- Developing new technologies for energy storage (batteries)
- Research into hydrogen as future fuel
- Tidal and wave energy research
Why The Four Taps is important:
- Singapore has no fossil fuel reserves or renewable energy resources (no rivers for hydroelectric, limited wind, limited geothermal)
- The Four Taps strategy ensures energy security and independence
- Balances current energy needs with future sustainability
- Reduces environmental impact
Important Definitions
Renewable energy: Energy from sources that can be naturally replenished or regenerated within a reasonable timeframe (solar, wind, water, geothermal, biomass).
Non-renewable energy: Energy from sources that cannot be quickly replaced and are finite (fossil fuels: coal, oil, natural gas).
Fossil fuel: Energy source formed from the remains of dead plants and animals buried underground for millions of years; includes coal, oil, and natural gas.
Greenhouse gas: Gases that trap heat in the atmosphere and contribute to global warming; main examples are carbon dioxide (CO₂) and methane (CH₄).
Climate change: Long-term shift in global temperatures and weather patterns, primarily caused by increased greenhouse gas emissions from burning fossil fuels.
Energy conservation: Practice of reducing energy consumption through more efficient use and avoiding unnecessary energy waste.
Air pollution: Contamination of the air by harmful substances (gases, particles) that damage health and the environment.
Acid rain: Rain containing sulfuric and nitric acids formed when sulfur dioxide and nitrogen oxides (from burning fossil fuels) react with water vapor in the atmosphere.
Power station: A facility that generates electricity, typically by burning fuel or using renewable energy sources.
Turbine: A rotating device that converts the energy of moving fluids (water, steam, or wind) into mechanical energy to generate electricity.
Carbon dioxide (CO₂): A colorless, odorless gas produced when fossil fuels are burned; a major greenhouse gas.
Methane (CH₄): A colorless, odorless, flammable gas; a potent greenhouse gas released from fossil fuel extraction and decomposition.
Worked Examples (PSLE-Style Questions)
Example 1: Identifying Renewable vs Non-Renewable
Question: Which of the following are renewable energy sources? A. Coal and oil B. Solar energy and wind energy C. Natural gas and biomass D. Oil and wind energy
Answer: B. Solar energy and wind energy
Explanation:
- Solar energy comes from the sun, which will continue to shine for billions of years, so it is renewable
- Wind energy comes from wind, which is continuously generated by the atmosphere, so it is renewable
- Coal and oil are non-renewable fossil fuels (take millions of years to form)
- Natural gas is a non-renewable fossil fuel
- Biomass can be renewable if sustainably harvested, but it takes time to grow, making it less reliable than solar and wind
Example 2: Understanding Fossil Fuel Formation
Question: Fossil fuels like coal and oil were formed from: A. Rocks and minerals that have been heated B. Dead plants and animals buried underground for millions of years C. Water and sand compressed together D. Volcanic ash and lava
Answer: B. Dead plants and animals buried underground for millions of years
Explanation:
- Coal formed from ancient forests that died and were buried
- Oil formed from dead sea plants and animals
- Over millions of years, pressure and heat transformed these organic materials into fossil fuels
- This process takes an extremely long time, which is why fossil fuels are non-renewable
Example 3: Environmental Impact
Question: Which of the following is a consequence of burning fossil fuels? A. Depletion of water resources B. Increase in oxygen levels in the atmosphere C. Release of carbon dioxide which contributes to climate change D. Cooling of the Earth’s atmosphere
Answer: C. Release of carbon dioxide which contributes to climate change
Explanation:
- Burning coal, oil, and natural gas releases carbon dioxide (CO₂)
- CO₂ is a greenhouse gas that traps heat in the atmosphere
- This causes global temperatures to rise, leading to climate change
- Climate change has effects like rising sea levels and extreme weather
- Water resources are affected by climate change, but not directly depleted by burning fossil fuels
- Burning fossil fuels does not increase oxygen; rather, some oxygen is consumed in combustion
Example 4: Advantages and Disadvantages
Question: Solar energy is a good renewable energy source for Singapore because: A. It is freely available from the sun which is abundant B. Singapore has long hours of sunshine throughout the year C. It does not produce air pollution or greenhouse gases D. All of the above
Answer: D. All of the above
Explanation:
- The sun provides free, inexhaustible energy
- Singapore, being near the equator, receives consistent sunshine year-round
- Solar energy produces zero emissions during operation
- However, challenges include cost of installation and weather-dependent output (rainy days reduce efficiency)
Example 5: Energy Conservation
Question: Which action best conserves energy at home? A. Leaving lights on so you don’t trip in the dark B. Using air conditioning at very low temperatures for comfort C. Turning off appliances when not in use and using LED bulbs D. Taking longer hot showers for cleanliness
Answer: C. Turning off appliances when not in use and using LED bulbs
Explanation:
- LED bulbs use 75% less energy than traditional incandescent bulbs
- Turning off appliances prevents standby power consumption
- These actions directly reduce energy use without affecting comfort or safety
- Excessive air conditioning, lights, and hot water all waste energy
- Safety can be maintained with moderate lighting
Example 6: Energy Sources and Applications
Question: Which energy source is most suitable for generating electricity in a country with rivers and mountains? A. Solar energy B. Wind energy C. Hydroelectric energy D. Biomass energy
Answer: C. Hydroelectric energy
Explanation:
- Hydroelectric power uses the energy of flowing or falling water
- Rivers provide a continuous source of flowing water
- Mountains provide height differences that increase water pressure and energy
- Countries like Norway and New Zealand use hydroelectric power extensively
- Solar and wind depend on weather conditions that may not be favorable
- Biomass takes time to accumulate in sufficient quantities
Example 7: Understanding Greenhouse Effect
Question: The greenhouse effect occurs when: A. Gases in the atmosphere absorb heat and prevent it from escaping to space B. Sunlight bounces off the atmosphere back into space C. Water vapor in the air reduces the amount of solar energy reaching Earth D. Ozone layer absorbs all harmful radiation from the sun
Answer: A. Gases in the atmosphere absorb heat and prevent it from escaping to space
Explanation:
- Greenhouse gases (CO₂, methane, water vapor) act like a blanket
- They allow sunlight to pass through but trap heat that would otherwise escape
- This causes global temperatures to rise
- This is essential for life (natural greenhouse effect), but increased emissions cause excessive warming
- Options B, C, and D describe different atmospheric phenomena but not the greenhouse effect
Example 8: Fossil Fuel Depletion
Question: Why are fossil fuels considered non-renewable? A. They can be replaced within 10 years if used carefully B. They form faster than we use them C. They take millions of years to form and we use them much faster than they are replaced D. They are renewable but become polluted when used
Answer: C. They take millions of years to form and we use them much faster than they are replaced
Explanation:
- Fossil fuels formed over 300+ million years from ancient organisms
- Current usage rates are millions of times faster than formation rates
- At current rates, known reserves may be depleted within a century
- Once coal and oil are used, they cannot be replenished in human timescales
- This is why transitioning to renewable energy is urgent
Common Mistakes to Avoid
16. Confusing Renewable with Inexhaustible
Mistake: Thinking renewable energy sources never run out in quantity Correct understanding: Renewable sources won’t run out, but their output can vary (e.g., solar depends on sunshine, wind depends on wind speed)
17. Thinking Fossil Fuels Can Last Forever if Used Slowly
Mistake: Believing fossil fuels are renewable if we just use less Correct understanding: Fossil fuels are non-renewable no matter the usage rate; they take millions of years to form
18. Ignoring Environmental Costs of Biomass
Mistake: Thinking all biomass energy is completely clean and sustainable Correct understanding: Biomass still produces air pollution when burned; its sustainability depends on responsible harvesting
19. Forgetting About Methane Leaks
Mistake: Thinking natural gas is clean because it burns cleanly Correct understanding: Methane leaks during extraction and transport are significant greenhouse gases (methane is 25-28 times more potent than CO₂)
20. Overlooking Energy Embedded in Production
Mistake: Forgetting that solar panels and wind turbines require energy to manufacture Correct understanding: Renewable energy systems eventually pay back their energy cost through production, but initial manufacturing uses energy
21. Underestimating Climate Change Impact
Mistake: Thinking climate change is a distant problem Correct understanding: Climate change is happening now with measurable effects (haze in Singapore, rising sea levels, extreme weather)
22. Forgetting Singapore’s Geographic Constraints
Mistake: Thinking Singapore can just build big dams or rely on wind farms Correct understanding: Singapore has limited land, no rivers suitable for dams, and inconsistent wind; The Four Taps strategy recognizes these constraints
23. Not Recognizing Energy Conservation as Priority
Mistake: Thinking renewable energy alone solves energy problems Correct understanding: Energy conservation is equally important; reducing consumption is faster and cheaper than replacing all energy sources
Exam Tips with Keywords
Important Keywords to Know and Use
- Renewable vs non-renewable — always clarify which type you’re discussing
- Fossil fuels — coal, oil, natural gas formed over millions of years
- Greenhouse gas — CO₂ and methane trap heat in atmosphere
- Climate change — long-term warming due to greenhouse gas emissions
- Energy conservation — reducing energy consumption through efficiency
- Air pollution — SO₂, NOₓ, and particulates from burning fossil fuels
- Advantages and disadvantages — always discuss both for each energy source
- Environmental impact — greenhouse effect, air pollution, ecosystem damage
- The Four Taps — Singapore’s energy strategy (natural gas, solar, imports, emerging tech)
Question Interpretation Tips
When asked about advantages:
- Think about: cost, availability, environmental impact, reliability, scalability
When asked about disadvantages:
- Think about: cost, environmental impact, geographical requirements, reliability, land use
When asked about environmental impact:
- Consider: air pollution (health), greenhouse gases (climate), ecosystems (biodiversity), resources (water)
When asked about energy conservation:
- Give specific, practical examples (LED bulbs, turning off appliances, shorter showers)
- Explain why each action saves energy
When asked to compare energy sources:
- Create a comparison table in your mind: cost, availability, reliability, environmental impact, suitability for Singapore
Answering Strategy for PSLE Questions
-
Read the question carefully — Identify what is being asked (advantage, disadvantage, cause, effect, example)
-
Check the options — Eliminate obviously wrong answers first
-
Use process of elimination — If unsure, eliminate answers that are clearly incorrect
-
Think about causes and effects — Many PSLE questions test understanding of relationships (burning fossil fuels → greenhouse gases → climate change)
-
Provide explanations — Don’t just state answers; brief explanations show understanding
-
Use proper terminology — Use correct scientific terms (e.g., “greenhouse gas” not “pollution gas”; “non-renewable” not “limited”)
-
Consider Singapore context — Questions often reference Singapore’s situation with energy and environmental challenges
Quick Summary
Types of Energy Sources
Renewable Energy Sources (Will not run out):
- Solar Energy — from sun, advantages: free and clean, disadvantages: weather dependent
- Wind Energy — from wind, advantages: clean and efficient, disadvantages: location dependent, land use
- Hydroelectric Energy — from flowing water, advantages: reliable and clean, disadvantages: requires specific geography, expensive
- Geothermal Energy — from Earth’s heat, advantages: consistent, disadvantages: limited locations
- Biomass Energy — from organic waste, advantages: uses waste, disadvantages: still pollutes when burned
Non-Renewable Energy Sources (Will eventually run out):
- Coal — from ancient plants, abundant but very polluting
- Oil — from dead sea organisms, convenient but causes spills and pollution
- Natural Gas — from sea organisms, cleaner than coal/oil but still fossil fuel
Why Fossil Fuels Will Run Out
- Take millions of years to form
- We use them thousands of times faster than they form
- Known reserves may be depleted within 50-200 years
Environmental Impact of Fossil Fuels
- Air pollution — causes respiratory diseases and smog
- Greenhouse effect — CO₂ and methane trap heat, causing climate change
- Climate change effects — rising sea levels, extreme weather, ecosystem damage
- Oil spills — devastating to marine ecosystems
What We Must Do
- Switch to renewable energy — solar, wind, hydro, geothermal, biomass
- Conserve energy — use less through efficiency
- Take action at home and school — LED bulbs, turn off appliances, shorter showers, public transport
Singapore’s Response
The Four Taps of Energy Strategy:
- Natural gas (current main source)
- Solar energy (rapid expansion on HDB rooftops)
- Imported electricity (from neighboring countries)
- Emerging technologies (hydrogen, energy storage)
This balanced approach recognizes Singapore’s constraints (small island, no fossil fuels, limited renewable resources) while ensuring sustainable energy future.
Key Facts to Remember
- Energy is essential for modern life
- Fossil fuels are non-renewable and damaging to environment
- Renewable energy is key to sustainable future
- Singapore has no indigenous fossil fuels or major renewable resources
- Energy conservation is as important as switching to renewable sources
- Individual actions (turning off lights, using public transport) contribute to energy conservation
- Climate change and air pollution are urgent global challenges
- Singapore’s sea level rise risk makes energy sustainability critical
Final Reminders for Jamie
Master the basics:
- Know the difference between renewable and non-renewable energy
- Understand how fossil fuels form and why they will run out
- Learn the main renewable energy sources and their key advantages/disadvantages
Connect concepts:
- Energy source → how it’s used → environmental impact → why we must change
- Fossil fuels → CO₂ emissions → greenhouse effect → climate change
- Renewable energy + conservation → sustainable future
Practice with examples:
- Use PSLE-style questions to test your understanding
- Explain concepts to someone else to check your mastery
- Create comparison tables for energy sources
Singapore context matters:
- Singapore’s energy challenges are unique due to geography
- The Four Taps strategy reflects these constraints
- Solar energy on HDB rooftops is a visible real-world example
Exam day tips:
- Use proper scientific terminology
- Always provide explanations, not just answers
- Consider environmental, economic, and social perspectives
- Think about cause and effect relationships
- Check your answer makes sense before moving on
Good luck, Jamie! Master these concepts, and energy questions will be straightforward.
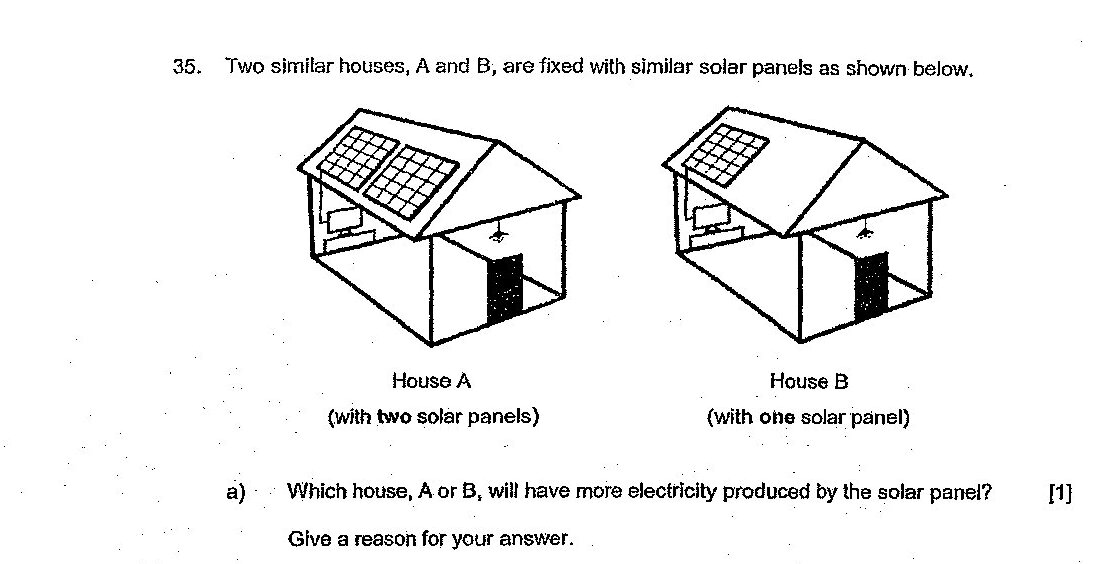
Which house, A or B, will have more electricity produced by the solar panel? Give a reason for your answer.
Fill in the boxes below to show the energy conversion as the wind-up handle is turned.
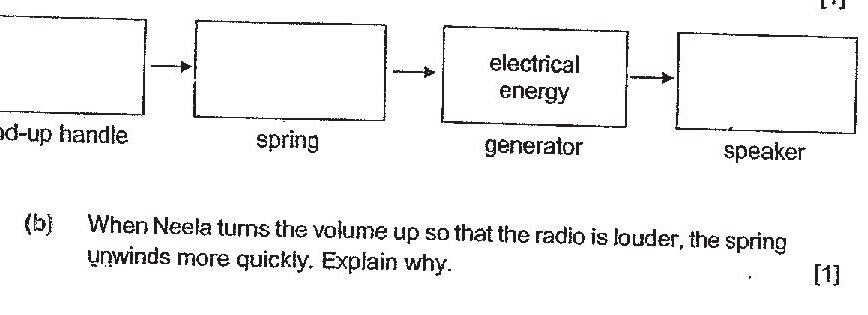
The radio has a solar cell which converts light energy to electrical energy. Neela winds up her radio in an open field without changing the volume. Give a reason why the spring unwinds slower when sunlight falls on the solar cell.
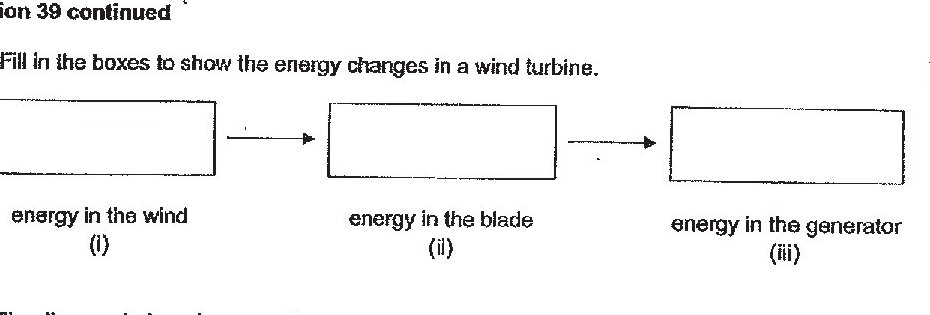
Fill in the boxes to show the energy changes in a wind turbine.
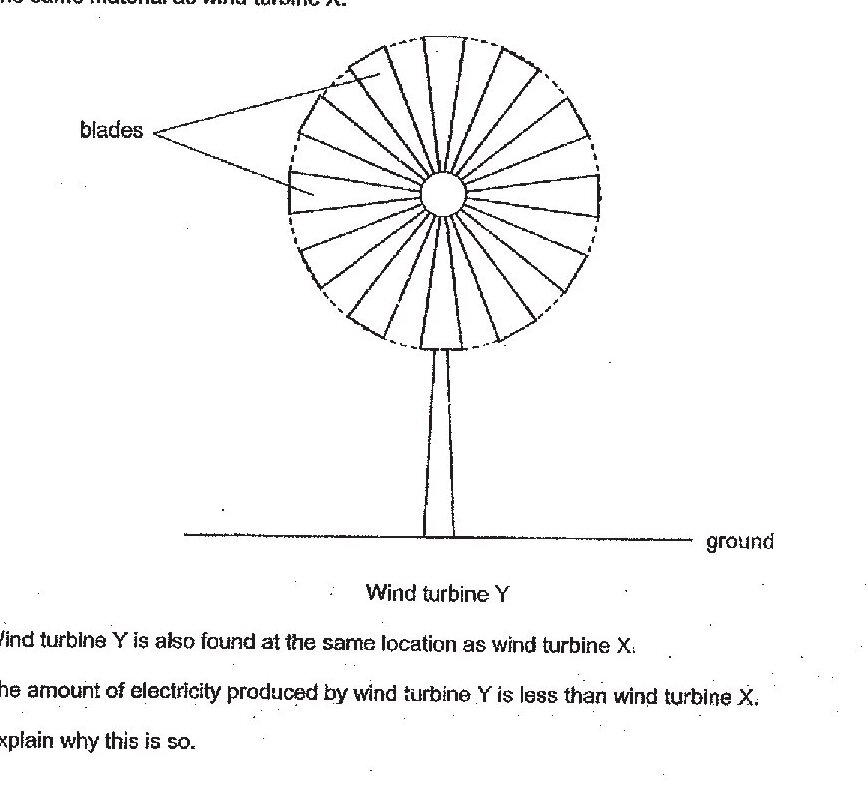
The amount of electricity produced by wind turbine Y is less than wind turbine X. Explain why this is so.
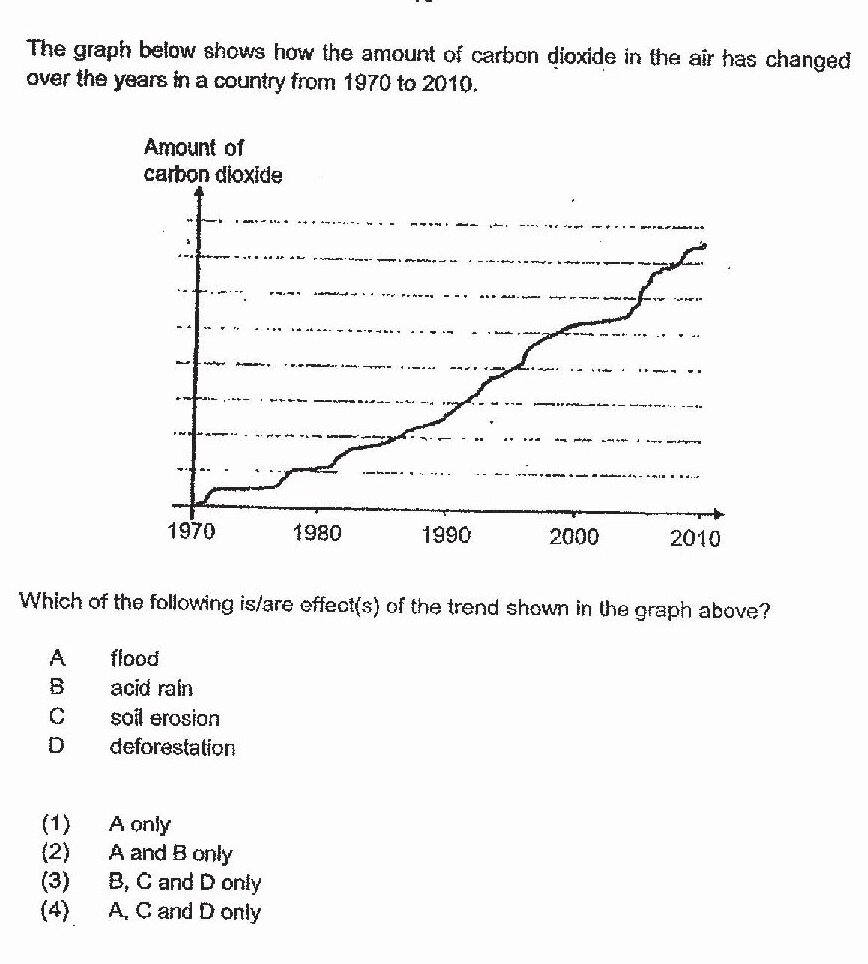
The graph below shows how the amount of carbon dioxide in the air has changed over the years in a country from 1970 to 2010. Which of the following is/are effect(s) of the trend shown in the graph above? A flood B acid rain C soil erosion D deforestation (1) A only (2) A and B only (3) B, C and D only (4) A, C and D only
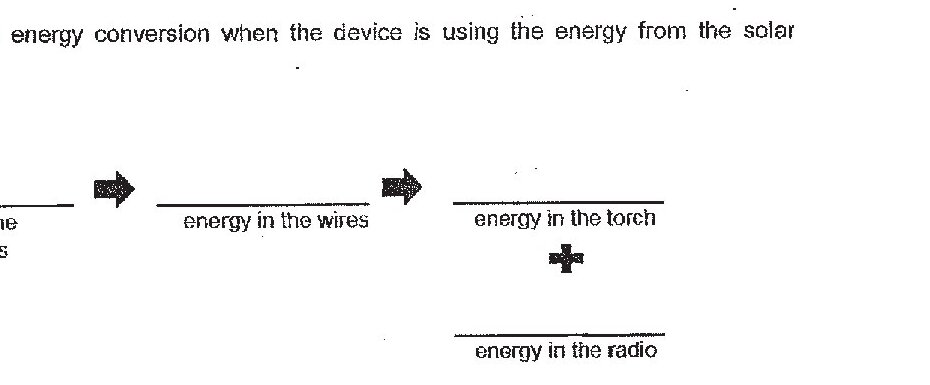
The four graphs below show the changes in global sea levels over a period of time. Which one of the following most likely shows the effect of continual deforestation activities on the sea level over time?
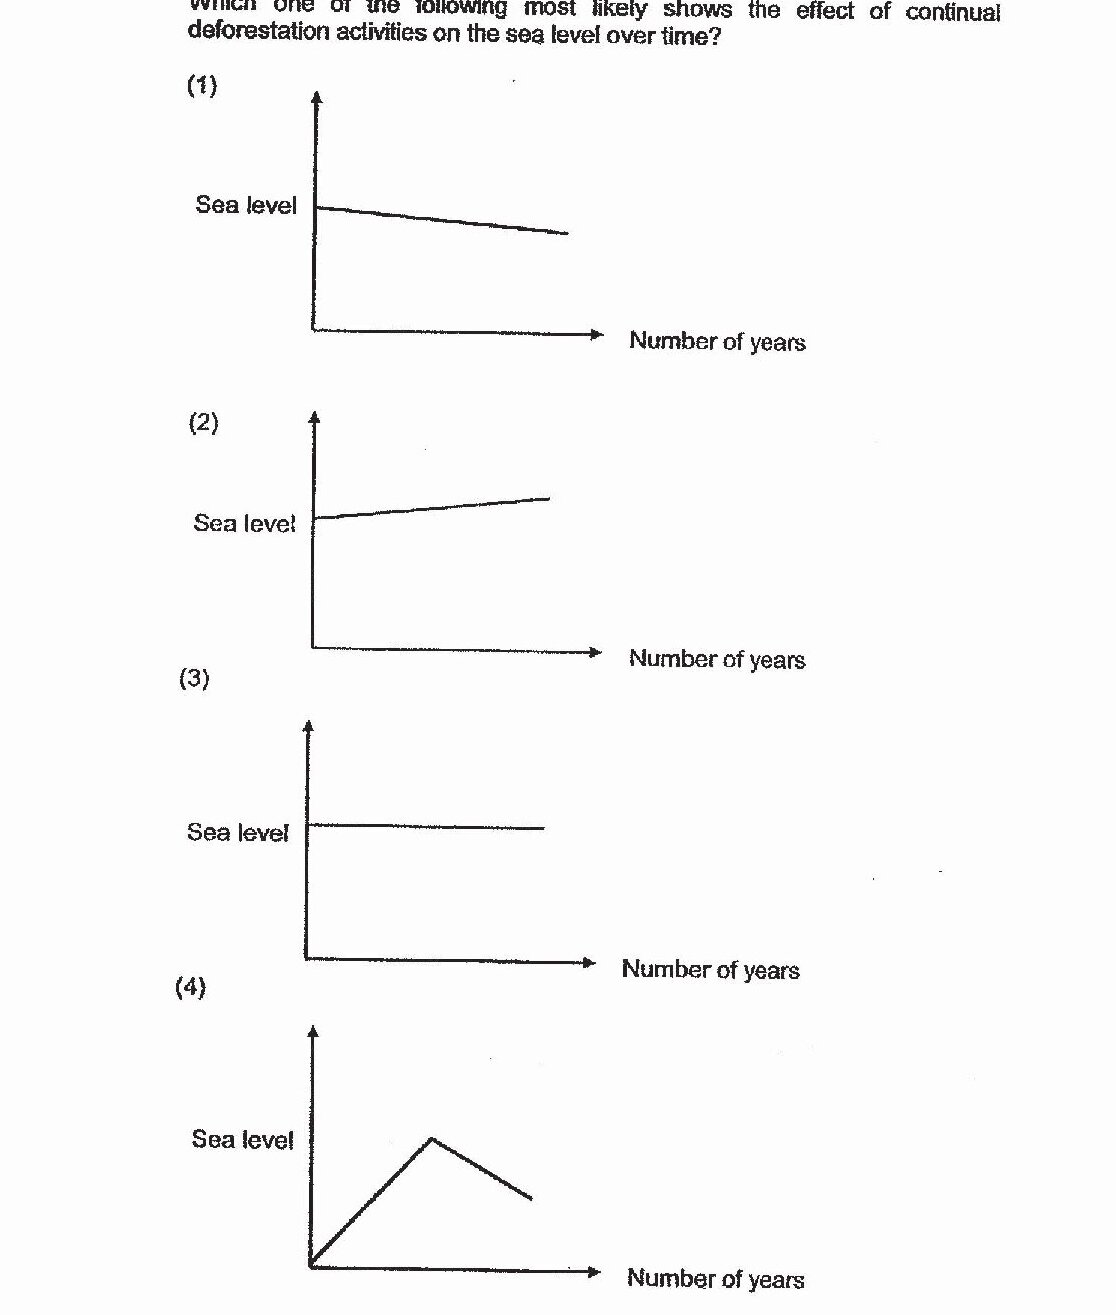
Complete the energy conversion when the device is using the energy from the solar panels.
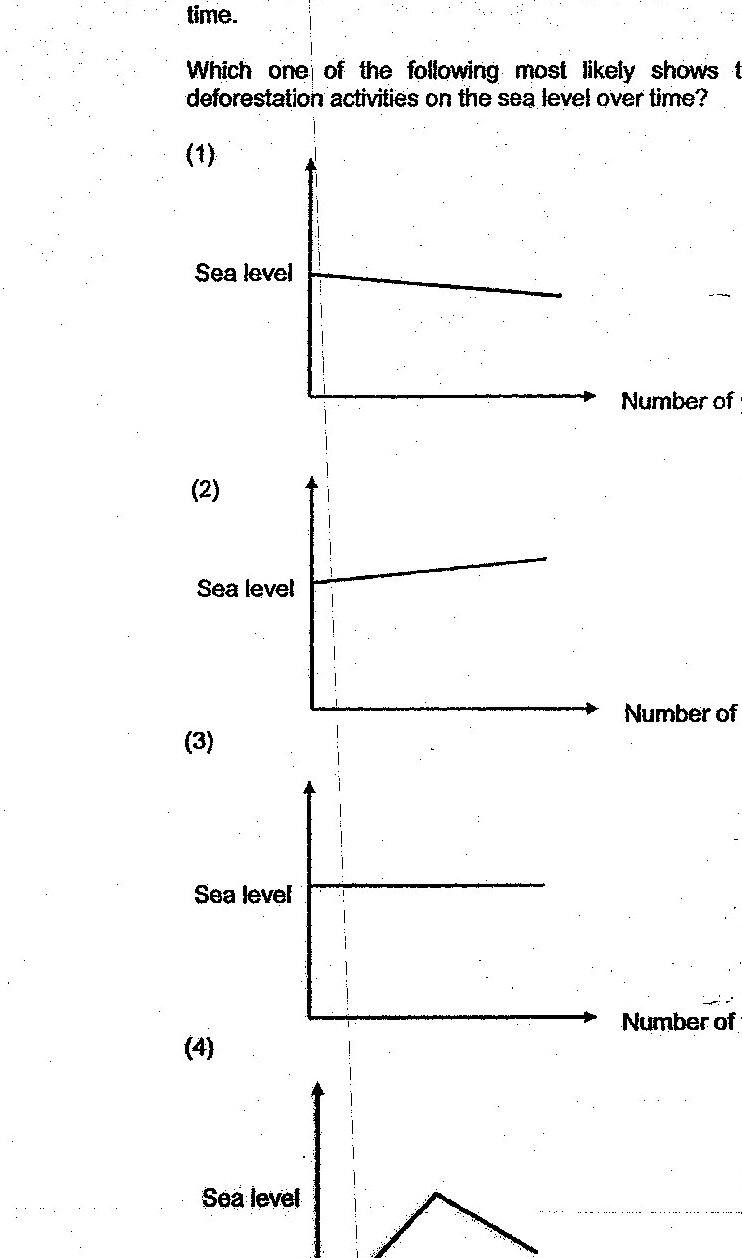
The four graphs below show the changes in global sea levels over a period of time. Which one of the following most likely shows the effect of continual deforestation activities on the sea level over time?
State the energy conversion from the running water to the electricity produced.
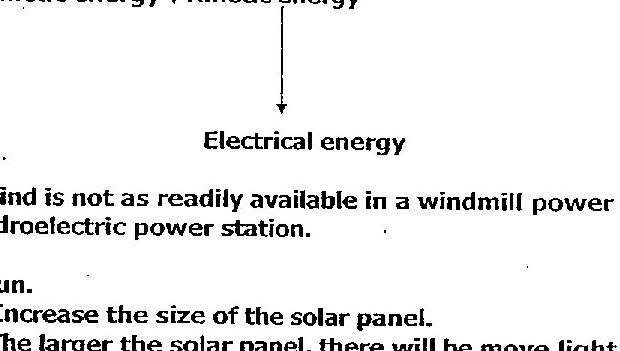
What is the advantage of a hydroelectric power station over a windmill power station?
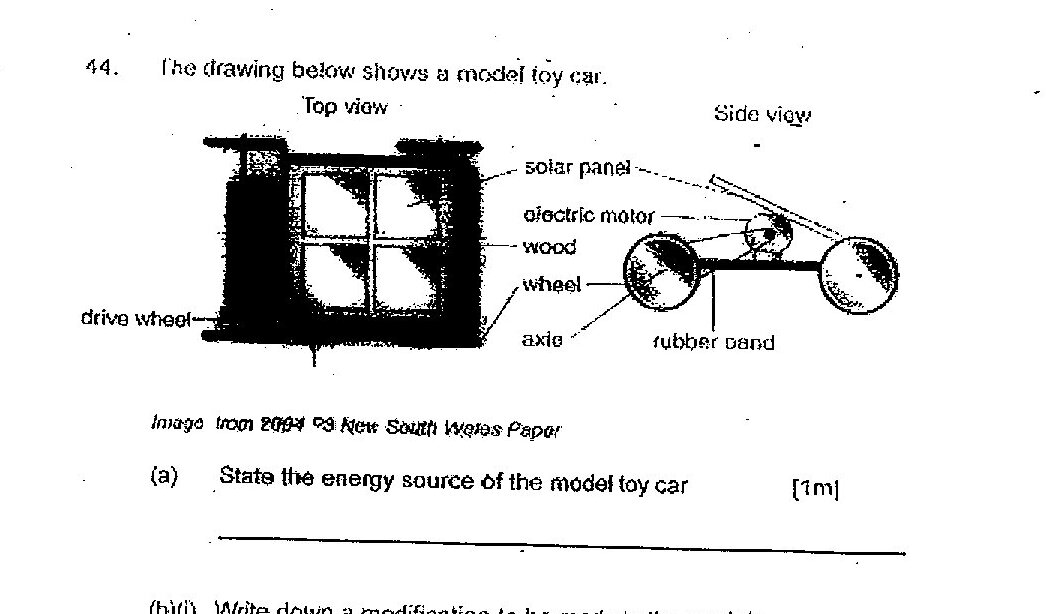
State the energy source of the model toy car
Which one of the following is not a direct cause of global warming?
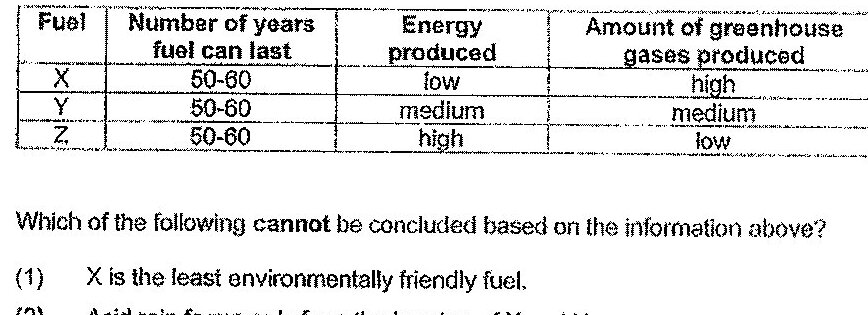
Greenhouse gases may be produced when fuels are burnt for energy. The table shows some information about three types of fuels, X, Y and Z. Which of the following cannot be concluded based on the information above?
Identify the main gas responsible for the increase in average temperature from 1990 and 2020 as shown in the graph above.
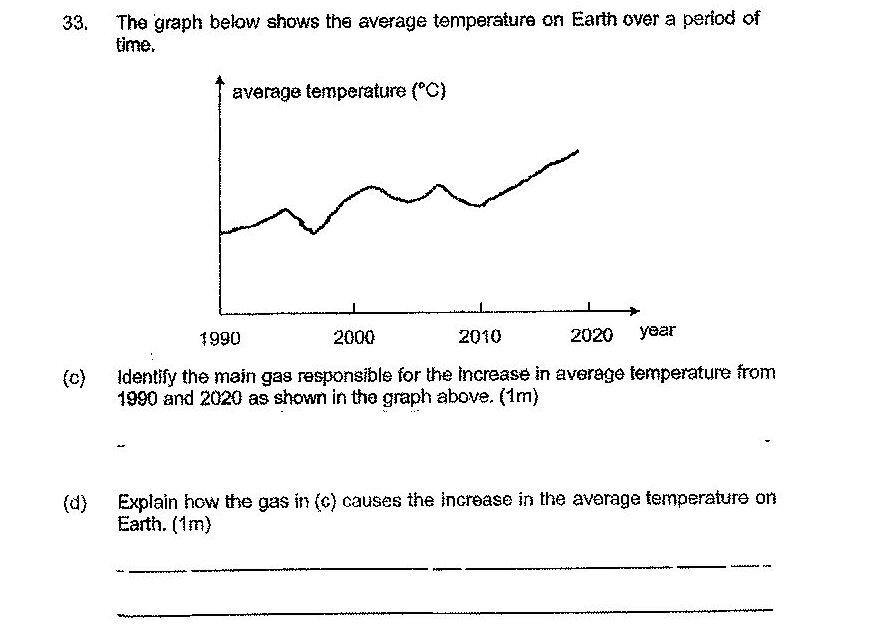
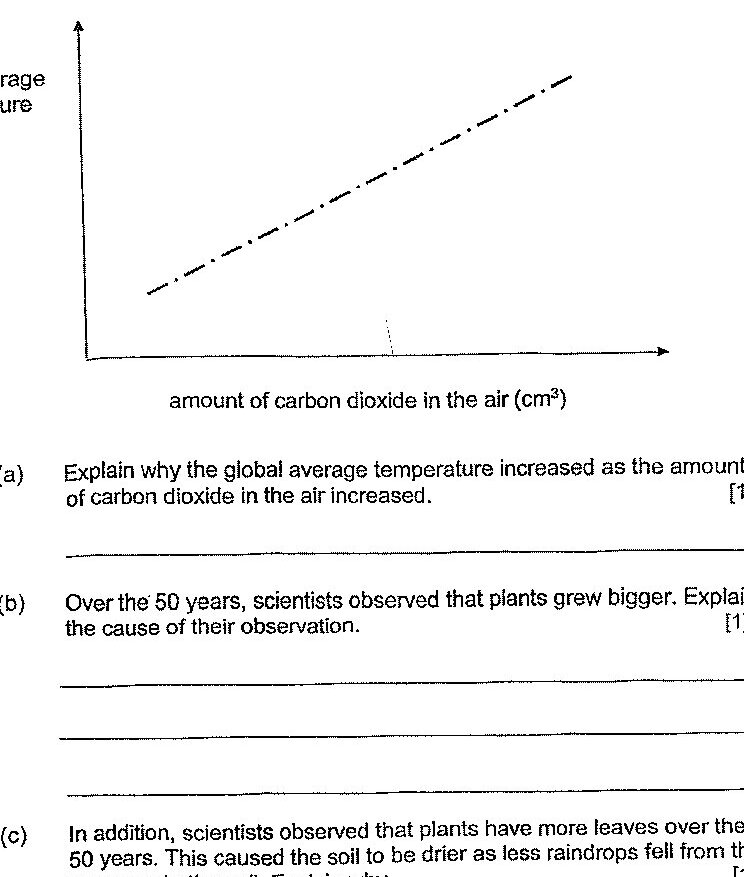
Explain why the global average temperature increased as the amount of carbon dioxide in the air increased.
Which of the following are sources of energy?
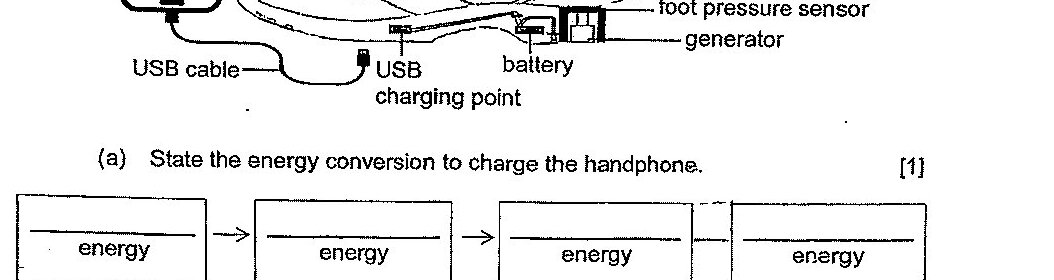
State the energy conversion to charge the handphone.
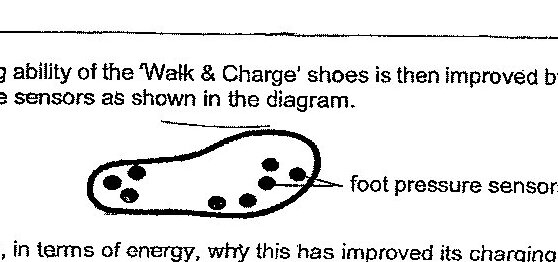
How does using the 'Walk & Charge' shoes as a source of energy benefit the Environment?
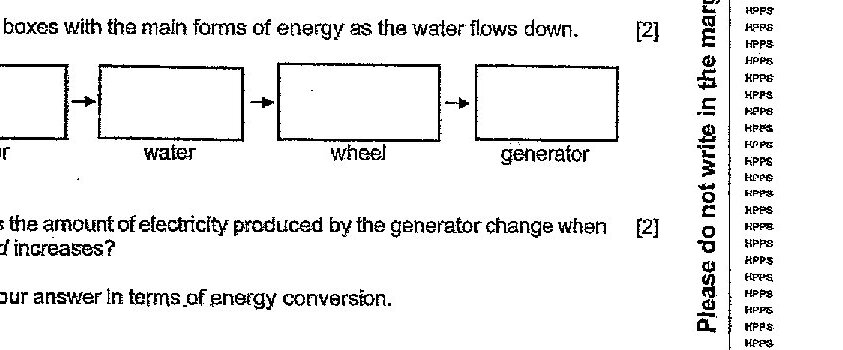
How does the amount of electricity produced by the generator change when distance d increases? Explain your answer in terms of energy conversion.
How does using the water wheel to produce electricity benefit the environment?
Which of the following are sources of energy?
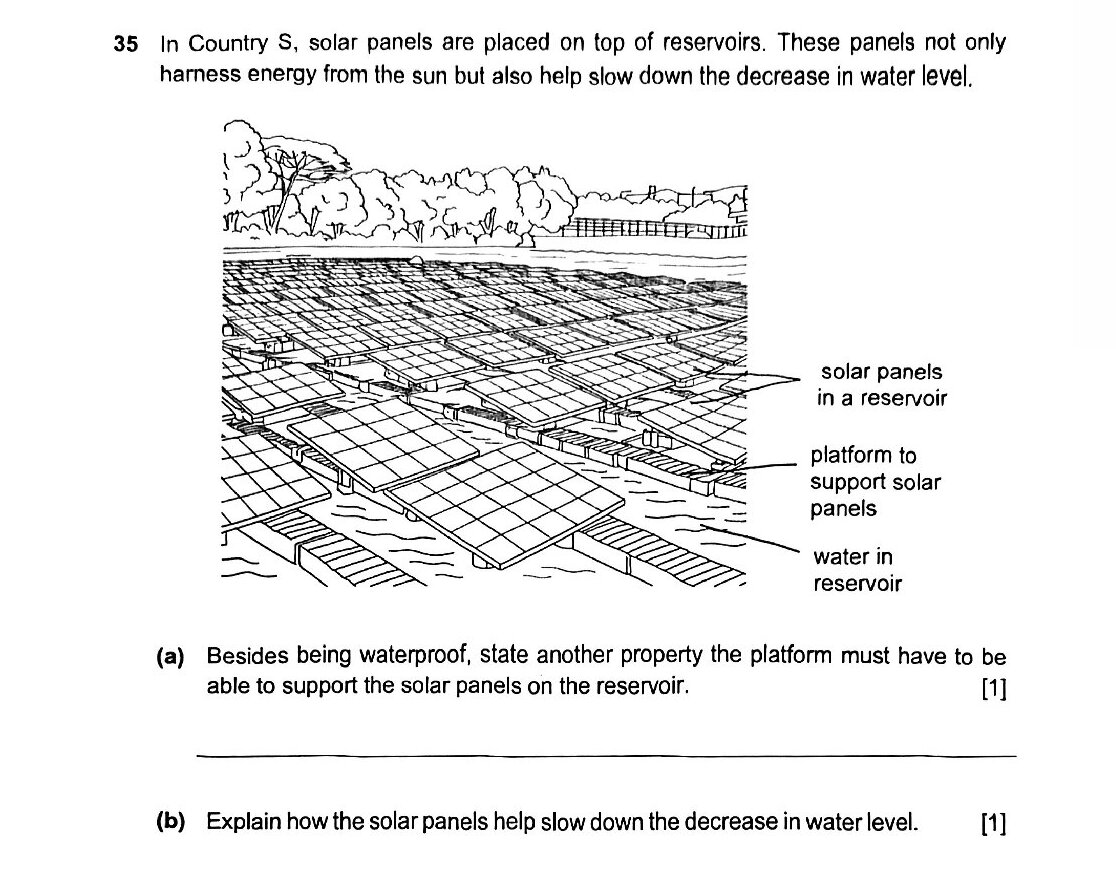
Explain how the solar panels help slow down the decrease in water level.
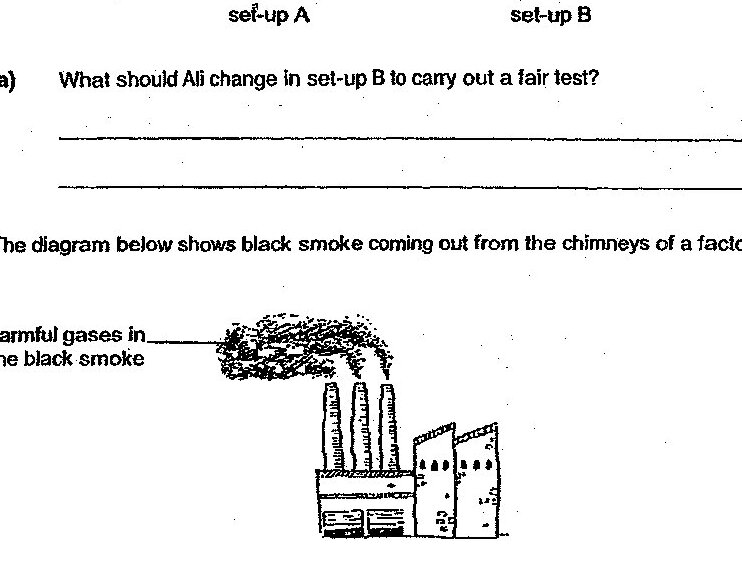
It was observed that the paint from the bodies of cars near this factory came off during the rainy season. Explain how the harmful gases present in the black smoke from the factory may have caused this.
Which of the following are positive benefits brought about by the developments in science and technology?
A scientist observed that the temperature of the air on Earth has increased over the last ten years. Which of the following activities could have caused the increase in the temperature?
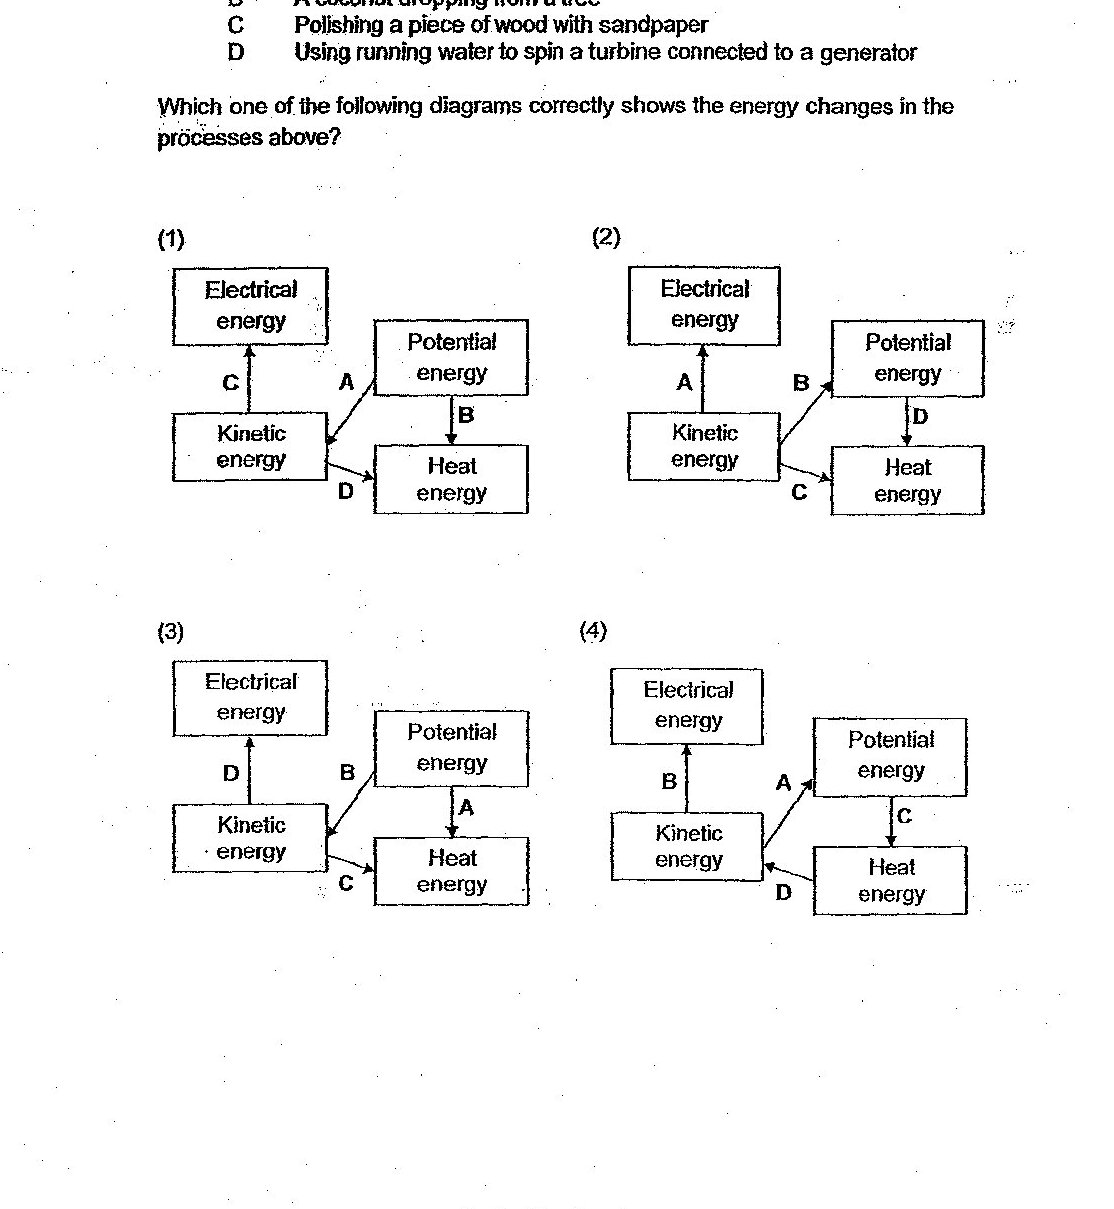
Some processes involving energy changes are listed below. A - Burning of natural gas B - A coconut dropping from a tree C - Polishing a piece of wood with sandpaper D - Using running water to spin a turbine connected to a generator Which one of the following diagrams correctly shows the energy changes in the processes above?
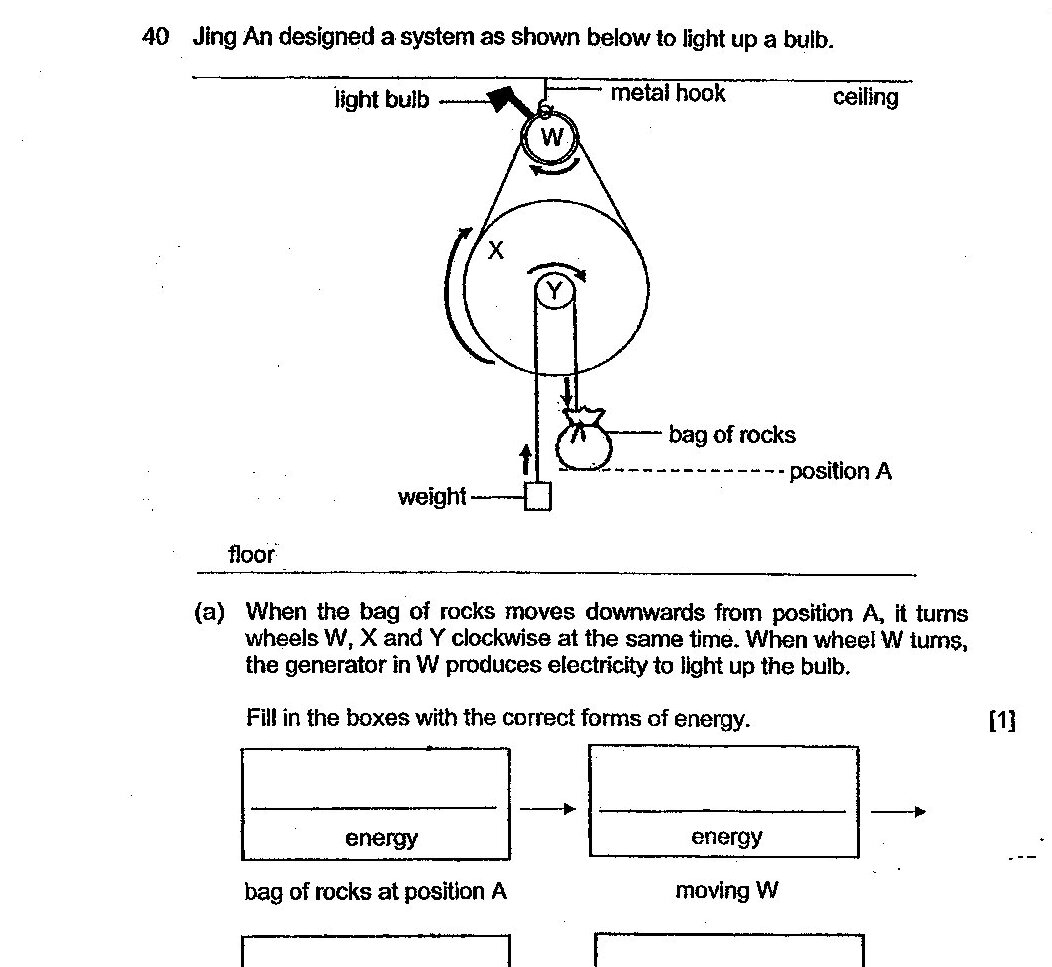
When the bag of rocks moves downwards from position A, it turns wheels W, X and Y clockwise at the same time. When wheel W turns, the generator in W produces electricity to light up the bulb. Fill in the boxes with the correct forms of energy.
Past year papers cover the full exam — browse by subject below.
View All Papers ›