Interactions within the Environment
Interactions within the Environment - Study Notes
Key Concepts
Food Chains and Food Webs
- Energy flow in ecosystems: Energy flows from the Sun through living organisms in a specific direction (one-way flow)
- The Sun is the ultimate source of energy for most living things on Earth
- Green plants capture light energy through photosynthesis and convert it into chemical energy stored in food
- Energy is transferred from one organism to another when one organism feeds on another
Food Chain Components:
- Producer: Green plants that make their own food through photosynthesis (e.g., grass, algae, trees)
- Consumer: Animals that eat other organisms for food
- Primary consumer (Herbivore): Animals that eat plants only (e.g., grasshopper, rabbit, cow)
- Secondary consumer (Carnivore): Animals that eat herbivores (e.g., frog, snake, fox)
- Tertiary consumer (Carnivore): Animals that eat other carnivores (e.g., hawk, lion)
- Decomposer: Organisms that break down dead matter (e.g., bacteria and fungi). Detritivores such as earthworms also feed on dead matter and help break it down.
Food Web Characteristics:
- A food web shows multiple interconnected food chains in an ecosystem
- Most animals eat more than one type of food, creating complex feeding relationships
- Food webs are more realistic representations of feeding relationships than simple food chains
- If one organism in a food web is removed, it affects multiple other organisms
Direction of arrows:
- Arrows in food chains and webs show the direction of energy flow
- Arrows point FROM the organism being eaten TO the organism doing the eating
- Example: Grass → Grasshopper (arrow shows energy flows from grass to grasshopper)
Identifying Consumers in a Food Web:
- To identify consumers, look for organisms that have at least one arrow pointing toward them — this means energy flows into them from another organism
- Producer elimination rule: Producers (plants) have NO arrows pointing toward them from other organisms — they make their own food and are never consumers
- Systematic approach: (1) understand that arrows show energy direction, (2) check each organism for incoming arrows, (3) count all organisms with at least one incoming arrow as consumers
- Any organism appearing in a food web that has no incoming arrows is a producer, not a consumer
Introducing a New Predator into a Food Web:
- When a new predator is introduced, it competes with existing predators that feed on the same prey
- The competing predators now have less food available, so their populations decrease
- Competing organisms may die of starvation
- Focus on DIRECT feeding relationships only — do not attempt to trace cascading effects through multiple steps of the food web
Types of Soil
- Sandy soil: Large particles, large air spaces between particles, drains quickly, retains little water
- Clay soil: Small particles, small air spaces between particles, drains slowly, retains a lot of water
- Loamy soil: A mixture of sand and clay, moderate drainage and water retention, best for most plants
Key principle: Soil particle size determines air space size, which determines drainage rate and water retention — larger particles = larger air spaces = faster drainage = less water retained.
Different plants have different soil requirements based on their natural habitat:
- Desert plants (e.g., cacti) prefer sandy/well-draining soil because they are adapted to dry conditions and their roots can rot in waterlogged soil
- Most plants prefer loamy soil because it provides a balance of drainage and moisture retention
Predator-Prey Relationships
Key Characteristics:
- Predator: An animal that hunts, kills, and eats another animal
- Prey: An animal that is hunted and eaten by a predator
- The population sizes of predators and prey affect each other
IMPORTANT DISTINCTION: The term “prey” refers only to animals that are hunted and eaten by other animals. Plants/producers are NEVER called prey even though animals eat them. Similarly, the term “predator” applies only to animals that eat other animals — an animal eating a plant is called a consumer, not a predator.
Population Cycles:
- When prey population increases → more food available for predators → predator population increases
- When predator population increases → more prey are eaten → prey population decreases
- When prey population decreases → less food for predators → predator population decreases
- When predator population decreases → fewer prey are eaten → prey population increases again
- This creates a continuous cycle
Important Relationships:
- One organism can be both predator and prey (e.g., a frog is prey to a snake but predator to a grasshopper)
- Predators help control prey populations, preventing overgrazing or overcrowding
- A balanced ecosystem requires both predators and prey
Adaptations of Organisms
What are adaptations?
- Special features or behaviors that help organisms survive in their environment
- Adaptations develop over many generations through natural selection
- Organisms with better adaptations are more likely to survive and reproduce
Types of Adaptations:
How to tell them apart:
- Structural adaptations answer the question: What does the organism HAVE? — these are physical features such as body parts, shapes, colours, and body coverings.
- Behavioural adaptations answer the question: What does the organism DO? — these are special actions or behaviours the organism performs.
Four main purposes of adaptations:
- Reduce or promote heat loss — e.g., thick fur reduces heat loss in cold climates; large ears promote heat loss in hot climates
- Obtain food — e.g., sharp claws and forward-facing eyes in predators; long beaks in nectar-feeding birds
- Escape from predators — e.g., camouflage, warning coloration, body armour, speed
- Reproduce — e.g., bright flowers to attract pollinators; large seeds with hooks to aid dispersal
Adaptations questions are cross-topic: Explaining HOW an adaptation works often requires knowledge from other topics:
- Heat transfer — to explain how fur, blubber, or large ears affect body temperature
- Photosynthesis — to explain adaptations in leaf size, shape, or colour in plants
- Forces — to explain streamlined body shapes for movement through water or air
- Water cycle / water loss — to explain waxy coatings, sunken stomata, or succulent stems in desert plants
When answering, identify which other topic is needed before writing your explanation.
Choose only the most relevant concept: Not every concept that seems related will score marks. For example, a plant growing under direct sun may trigger thoughts about light intensity (photosynthesis) — but if the question is about survival in heat, the relevant concepts are heat gain and water loss, not light intensity. Always match your concept to the specific condition in the question.
A. Structural Adaptations (Physical Features):
For finding and capturing food:
- Sharp claws and teeth in carnivores (e.g., lions, eagles)
- Long beaks in birds for reaching nectar or insects (e.g., hummingbirds, woodpeckers)
- Sticky tongue in chameleons for catching insects
- Strong sense of smell or hearing in predators
- Forward-facing eyes in predators for judging distance
For avoiding predators:
- Camouflage: Body color matches surroundings (e.g., green grasshopper in grass)
- Body armor: Hard shells or spines (e.g., tortoise, porcupine)
- Speed: Fast running to escape (e.g., deer, rabbit)
- Warning coloration: Bright colors warn predators of poison (e.g., poison dart frog)
For survival in habitat:
- Thick fur in cold climates (e.g., polar bear)
- Large ears for heat loss in hot climates (e.g., elephant)
- Waxy leaves in plants to reduce water loss
- Deep roots in desert plants to reach underground water
- Wide leaves in rainforest plants to capture more sunlight
B. Behavioral Adaptations:
- Migration: Moving to different areas for better conditions
- Hibernation: Sleeping through cold seasons when food is scarce
- Nocturnal behavior: Being active at night to avoid heat or predators
- Playing dead to fool predators
C. Choosing the Correct Function of an Adaptation
A common P6 exam challenge is selecting the correct function of a feature when multiple explanations seem possible. Follow these principles:
- Consider all survival needs: Adaptations can serve four types of survival needs — (1) finding or catching food, (2) avoiding or deterring predators, (3) reproduction, (4) coping with harsh environmental conditions (heat, cold, drought, etc.). Do not assume an adaptation is only about predators.
- Use all context clues: Before deciding what a feature is for, read the organism’s habitat, diet, and behaviour carefully. The same feature (e.g. coloration) may serve different functions in different organisms.
- Match the feature to the habitat: A flat, disc-like body shape in a reef fish helps it pass through narrow gaps in coral or seagrass — a food-finding adaptation, not a predator-avoidance one.
- Small, pointed mouth in reef fish: Allows feeding inside narrow crevices between coral or seagrass — an adaptation for finding food, not for escaping predators.
- Eye-spot markings: A dark spot with a white ring located near the tail (not the real eye) acts as a false eye. It deceives predators into attacking the tail region rather than the real head, improving the fish’s chance of escaping with a non-fatal injury. Describe this as redirecting or deceiving predators, NOT as camouflage.
- Stripes on the real eye: Dark stripes that cross or cover the actual eye reduce its visibility. Combined with a false eye-spot elsewhere, these create misdirection — predators are confused about which end is the head.
Man’s Impact on Environment
Negative Impacts:
1. Deforestation:
- Cutting down forests for timber, agriculture, or urban development
- Effects:
- Loss of habitats for animals and plants
- Some species may become extinct
- Soil erosion increases significantly because deforestation removes both (a) the leaf canopy, which normally slows down rainwater flow and reduces the impact force of water hitting the soil, and (b) the root systems, which anchor the soil by holding it more firmly and preventing it from being washed away
- Two factors determine the amount of soil erosion: the impact force of water hitting the soil, and how anchored the soil is
- More vegetation = less soil erosion; fewer plants = greater soil erosion
- Soil erosion is the process by which water washes away topsoil
- Reduced oxygen production and increased carbon dioxide
- Disrupted food chains and food webs
2. Pollution:
Air Pollution:
- Caused by: Vehicle exhaust, factory emissions, burning fossil fuels
- Effects:
- Breathing difficulties in humans and animals
- Acid rain damages plants and water bodies
- Global warming and climate change
Acid Rain (Detailed):
- Acid rain forms when rainwater mixes with pollutants (harmful chemicals / toxic substances) released into the air by factories, power plants, and vehicles
- Acid rain corrodes buildings and outdoor structures, damaging their surfaces over time
- Acid rain collects in water bodies (rivers, lakes, ponds), causing the water habitat to become acidic
- Aquatic organisms that cannot adapt to the increased acidity of the water will die
Water Pollution:
- Caused by: Industrial waste, sewage, oil spills, littering, animal waste (from farms and livestock)
- Effects:
- Death of aquatic plants and animals
- Contaminated drinking water
- Disrupted aquatic food chains
Mechanism of oxygen depletion:
- Animal waste and untreated sewage contain large amounts of bacteria
- When these enter water bodies, bacteria use dissolved oxygen to respire and decompose the waste
- This process reduces the amount of dissolved oxygen in the water downstream
- Aquatic plants and animals downstream die because dissolved oxygen levels fall too low
- Contaminated water is also unsafe for drinking by humans and animals
Analysing pollution along a river:
- Always identify the direction of river flow before comparing sample points
- The location upstream (before farms, villages, or other pollution sources) has higher dissolved oxygen levels
- The location downstream (after pollution sources) has lower dissolved oxygen levels because bacteria have been consuming it
- In exam questions, ‘sample point X’ typically refers to the upstream location and ‘sample point Y’ to the downstream location — confirm this by checking the diagram’s flow direction
Land Pollution:
- Caused by: Littering, improper waste disposal, use of pesticides
- Effects:
- Soil contamination affecting plant growth
- Animals may eat harmful substances
- Groundwater contamination
3. Overfishing and Overhunting:
- Taking too many animals from their natural habitat
- Effects:
- Reduced populations, possibly leading to extinction
- Disrupted food chains
- Affected predator-prey relationships
4. Introduction of Non-Native Species:
- Bringing organisms to new environments where they don’t naturally live
- Effects:
- May become invasive and outcompete native species
- Can disrupt existing food webs
- May have no natural predators in new environment
Fair Test and Data Interpretation (Acid Rain Experiments)
- Fair test principle: Use the same volume of rainwater for each set-up so that volume is not a variable; the only changed variable should be the location from which the rainwater was collected
- Comparative analysis: When interpreting results, always compare data across ALL locations/conditions — do not describe the result for one location in isolation
Positive Actions (Conservation):
1. Protect Habitats:
- Establish nature reserves and national parks
- Protect endangered species and their habitats
- Reforestation: Planting new trees to replace those cut down
2. Reduce Pollution:
- Use cleaner energy sources (solar, wind)
- Proper waste disposal and recycling
- Reduce use of harmful chemicals
- Use public transport to reduce vehicle emissions
3. Sustainable Practices:
- Sustainable fishing: Only catch limited amounts
- Controlled hunting seasons
- Reduce, Reuse, Recycle (3Rs)
4. Breeding Programs:
- Captive breeding of endangered animals
- Release animals back into protected habitats
The Carbon Cycle (Basic)
Carbon is an essential element for all living things. The carbon cycle describes how carbon moves between the atmosphere, living organisms, and the environment in a continuous cycle.
Key processes in the carbon cycle:
1. Photosynthesis (removes CO₂ from the atmosphere)
- Green plants absorb carbon dioxide (CO₂) from the air during photosynthesis
- Plants use CO₂ + water + light energy → glucose (stored in plant tissues) + oxygen
- This removes carbon from the atmosphere and stores it in plants
2. Respiration (releases CO₂ into the atmosphere)
- All living organisms (plants, animals, decomposers) carry out respiration
- Glucose + oxygen → carbon dioxide + water + energy
- This releases carbon back into the atmosphere as CO₂
3. Feeding (transfers carbon between organisms)
- When animals eat plants or other animals, carbon stored in food is transferred to the animal’s body
- Carbon moves through the food chain via feeding relationships
4. Decomposition (releases CO₂ back into atmosphere)
- When plants and animals die, decomposers (bacteria, fungi) break down dead matter
- Decomposition releases carbon dioxide back into the atmosphere
- This returns carbon from dead organic matter to the atmosphere
5. Burning of fossil fuels (releases stored CO₂)
- Fossil fuels (coal, oil, natural gas) are formed from ancient dead organisms over millions of years
- Burning fossil fuels releases the stored carbon as CO₂ into the atmosphere
- This is a major reason why atmospheric CO₂ levels are increasing
Summary of carbon cycle:
| Process | What happens to CO₂ |
|---|---|
| Photosynthesis (by plants) | CO₂ absorbed from atmosphere |
| Respiration (all organisms) | CO₂ released into atmosphere |
| Decomposition (by decomposers) | CO₂ released into atmosphere |
| Burning fossil fuels | CO₂ released into atmosphere |
| Feeding | Carbon transferred between organisms (no net CO₂ change yet) |
Why the carbon cycle matters:
- Carbon dioxide is a greenhouse gas — too much CO₂ in the atmosphere causes global warming and climate change
- Deforestation reduces the number of plants absorbing CO₂, increasing atmospheric CO₂
- Burning fossil fuels adds extra CO₂ that was stored underground for millions of years
- A balanced carbon cycle keeps atmospheric CO₂ at stable levels
Important Definitions
Producer: A green plant that makes its own food through photosynthesis and is the first organism in a food chain.
Consumer: An organism that cannot produce its own food and must obtain its energy from plants or animals. (Note: decomposers also cannot make their own food but have a separate classification — the key phrase for consumers is ‘obtain energy from plants or animals’ through feeding.)
Primary Consumer: A herbivore that feeds directly on producers (plants).
Secondary Consumer: A carnivore that feeds on primary consumers (herbivores).
Tertiary Consumer: A carnivore that feeds on secondary consumers (other carnivores).
Herbivore: An animal that eats only plants.
Carnivore: An animal that eats only other animals.
Omnivore: An animal that eats both plants and animals.
Decomposer: An organism that breaks down dead plants and animals into simpler substances, returning nutrients to the soil.
Food Chain: A diagram that shows how energy flows from one organism to another through feeding relationships.
Food Web: A diagram that shows many interconnected food chains in an ecosystem, representing more complex feeding relationships.
Predator: An animal that hunts, kills, and eats another animal for food.
Prey: An animal that is hunted and eaten by a predator.
Adaptation: A special feature or behavior that helps an organism survive in its environment.
Camouflage: A type of adaptation where an organism’s color or pattern helps it blend in with its surroundings.
Habitat: The natural home of an organism where it can find food, water, shelter, and space.
Ecosystem: A community of living organisms interacting with each other and their non-living environment.
Deforestation: The clearing or cutting down of forests on a large scale.
Pollution: The introduction of harmful substances into the environment.
Soil Erosion: The process by which water washes away topsoil. Soil erosion increases when vegetation is removed because there are no leaves to slow rainwater flow and no roots to anchor the soil.
Extinct: When a species has completely died out and no longer exists.
Conservation: The protection and preservation of the natural environment and wildlife.
Carbon cycle: The continuous movement of carbon between the atmosphere, living organisms, and the environment through processes such as photosynthesis (removes CO₂), respiration (releases CO₂), decomposition (releases CO₂), and burning of fossil fuels (releases CO₂).
Fossil fuels: Fuels formed from the remains of ancient dead organisms (coal, oil, natural gas) over millions of years; burning them releases stored carbon as CO₂ into the atmosphere.
Worked Examples
Water Retention Experiment
Setup: 100 ml of water is poured through identical funnels lined with filter paper, each containing a different soil type. After 15 minutes, the volume of water collected in a measuring cylinder is recorded for each soil.
Interpretation rule: Greatest volume collected = least water retained = fastest drainage = largest air spaces between particles.
Sample question: A student tested three soils (A, B, C) and collected the following volumes after 15 minutes: Soil A = 30 ml, Soil B = 55 ml, Soil C = 80 ml. Which soil is most suitable for planting cacti? Explain your answer.
Model answer (3-step structure):
- Step 1 — Plant requirement: Cacti grow in deserts and require soil that retains little water (well-draining soil).
- Step 2 — Experimental evidence: Soil C collected the greatest volume of water (80 ml), meaning it retained the least water of the three soils tested.
- Step 3 — Soil structure explanation: Soil C has the largest air spaces between its particles, which allows water to drain through it the fastest.
Conclusion: Therefore, Soil C is the most suitable soil for planting cacti because it drains the fastest and retains the least water, matching the conditions cacti are adapted to.
Example 1: Interpreting a Food Chain
Question: Study this food chain: Grass → Caterpillar → Bird → Snake
a) Identify the producer. b) Which organism is the secondary consumer? c) What would happen if all the birds died due to disease?
Step-by-step solution:
Part a)
- Look for the first organism in the food chain
- Producers are always green plants that make their own food
- Answer: The producer is grass
Part b)
- Count the positions from the producer
- Primary consumer = eats producer (Caterpillar)
- Secondary consumer = eats primary consumer (Bird eats caterpillar)
- Answer: The bird is the secondary consumer
Part c)
- Think about what the bird eats and what eats the bird
- Effects on caterpillar (prey of bird):
- Birds normally eat caterpillars
- Without birds, caterpillars are not eaten
- Caterpillar population will increase
- Effects on snake (predator of bird):
- Snakes eat birds
- Without birds, snakes have no food
- Snake population will decrease or snakes must find other food
Answer: The caterpillar population will increase because they are not being eaten by birds. The snake population will decrease because they have lost their food source.
Example 2: Analyzing a Food Web Impact
Question: In a garden food web:
- Lettuce is eaten by snails and caterpillars
- Snails are eaten by birds and frogs
- Caterpillars are eaten by birds
- Frogs are eaten by snakes
- Birds are eaten by snakes
The gardener uses pesticide that kills all the caterpillars. Explain what happens to: a) The bird population b) The frog population
Step-by-step solution:
Part a) Bird population:
Step 1: Identify what birds eat
- Birds eat both snails and caterpillars
Step 2: Determine immediate effect
- Caterpillars are dead (no food from this source)
- Birds still have snails to eat
Step 3: Consider competition
- Without caterpillars, birds must eat more snails
- More birds competing for snails
Step 4: Consider the lettuce
- Caterpillars no longer eat lettuce
- More lettuce available for snails
- Snail population may increase (more food)
Answer: Initially, the bird population may decrease slightly because they have less food (no caterpillars). However, the bird population may recover because snail population increases (since snails have more lettuce to eat and caterpillars are not competing for lettuce), providing more food for birds.
Part b) Frog population:
Step 1: Identify what frogs eat
- Frogs eat snails
Step 2: Analyze the change
- As explained above, snail population may increase
- More snails = more food for frogs
Step 3: Consider competition
- Birds also eat snails
- Birds and frogs compete for snails
- Effect is less clear
Answer: The frog population may increase because there are more snails (their food source) available. However, frogs must compete with birds for snails, which may limit the increase.
Example 3: Identifying Adaptations
Question: A tiger has the following features:
- Orange fur with black stripes
- Sharp claws and teeth
- Eyes facing forward
- Padded feet for silent walking
Explain how TWO of these features help the tiger survive.
Step-by-step solution:
Step 1: Choose two features to explain
Step 2: For each feature, state:
- What type of adaptation it is
- How it helps the tiger survive
- Connect to either finding food or avoiding danger
Feature 1: Orange fur with black stripes
- This is camouflage (structural adaptation)
- The stripes help the tiger blend in with tall grass and shadows in the forest
- This helps the tiger hunt because prey animals cannot see the tiger approaching
- The tiger can get close to prey before attacking, making hunting more successful
Answer 1: The orange fur with black stripes provides camouflage that helps the tiger blend in with its surroundings (tall grass and forest shadows). This allows the tiger to sneak up on prey without being seen, increasing its chances of catching food.
Feature 2: Sharp claws and teeth
- These are structural adaptations for a carnivore
- Sharp claws help grip and hold struggling prey
- Sharp teeth help tear meat and kill prey quickly
Answer 2: The sharp claws and teeth help the tiger catch and kill prey. The claws grip the prey animal firmly while the sharp teeth can bite through flesh, allowing the tiger to feed on other animals for energy.
Alternative Feature: Eyes facing forward
- This is a structural adaptation common in predators
- Forward-facing eyes allow both eyes to look at the same thing
- This gives good depth perception (ability to judge distances)
- Helps the tiger know exactly how far to jump when attacking prey
Alternative Answer: The forward-facing eyes help the tiger judge distances accurately. This allows the tiger to know exactly when to pounce on prey, making it a more successful hunter.
Common Mistakes to Avoid
Mistake 1: Drawing Arrows in the Wrong Direction
Wrong: Grass ← Rabbit (arrow pointing to the grass) Correct: Grass → Rabbit (arrow pointing to the rabbit) Remember: Arrows show the direction of energy flow, pointing FROM food TO feeder (FROM the eaten TO the eater)
Mistake 2: Confusing Herbivore and Carnivore
Wrong: Saying “The rabbit is a carnivore because it is eaten by a fox” Correct: “The rabbit is a herbivore because it eats plants (grass)” Remember: An organism’s classification depends on what IT eats, not what eats it
Mistake 3: Thinking Energy Flows in All Directions
Wrong: “Energy can flow back from carnivore to herbivore” Correct: “Energy flows in one direction only: from Sun → Producer → Primary Consumer → Secondary Consumer” Remember: Energy is used up as it passes through each organism and cannot flow backward
Mistake 4: Including the Sun in the Food Chain Arrow Sequence
Wrong: Sun → Grass → Rabbit → Fox (putting the Sun inside the food chain) Correct: Food chains begin with the producer (a green plant). The Sun provides energy for photosynthesis but is NOT part of the food chain arrow sequence. Energy flow diagrams may show the Sun, but food chains start with the producer. Remember: Grass → Rabbit → Fox is a correct food chain. The Sun is the energy source behind the producer, but it is not written as part of the food chain itself.
Mistake 5: Incomplete Explanations of Food Web Changes
Wrong: “If grasshoppers die, frogs will die” (too simple) Correct: “If grasshoppers die, frogs will have less food available. The frog population will decrease because they cannot get enough energy to survive.” Remember: Explain the effect on BOTH predator and prey, and mention food/energy
Mistake 6: Confusing Predator and Prey
Wrong: “The rabbit is the predator because it is always running away” Correct: “The rabbit is the prey because it is hunted and eaten by the fox (predator)” Remember: Predator = hunter that eats; Prey = hunted and eaten
Mistake 7: Not Explaining HOW Adaptations Help
Wrong: “The polar bear has thick fur” (just stating the feature) Correct: “The polar bear has thick fur which keeps it warm in cold Arctic temperatures, helping it survive in its cold habitat” Remember: Always explain HOW the adaptation helps the organism survive (link to food, protection, or habitat conditions)
Mistake 8: Thinking All Human Activities are Negative
Wrong: Listing only harmful activities when asked about human impact Correct: Recognizing both negative impacts (deforestation, pollution) and positive actions (conservation, reforestation) Remember: Humans can help the environment through conservation efforts
Mistake 9: Confusing Decomposers with Consumers
Wrong: “Decomposers are consumers because they eat dead things” Correct: “Decomposers break down dead organisms and return nutrients to the soil; they have a special role different from consumers” Remember: Decomposers break down, not just eat; they recycle nutrients
Mistake 10: Not Understanding Population Cycles
Wrong: “When prey increases, predators eat them all immediately” Correct: “When prey increases, predators have more food, so predator population gradually increases. Eventually, more predators eat more prey, causing prey population to decrease” Remember: Population changes take time and follow a cycle, not instant changes
Mistake 11: Soil Questions — Describing Only One Soil Without Comparing All Options
Wrong: ‘Soil C is suitable for cacti because it drains well’ Correct: Compare all soils tested and use superlative language — ‘Soil C collected the greatest volume (80 ml), meaning it retained the least water of all three soils’ Remember: Always compare ALL soils listed, not just the one you choose
Mistake 11b: Using Non-Superlative Language
Wrong: ‘Soil C retained little water’ Correct: ‘Soil C retained the least water’ (use superlative: most/least/greatest/smallest) Remember: For ‘most suitable’ questions, always use superlative or comparative language
Mistake 11c: Stating a Soil is Suitable Without Linking Soil Property to Plant Requirement
Wrong: ‘Soil C is suitable for cacti’ Correct: ‘Soil C is suitable for cacti because cacti require well-draining soil (as they grow in deserts), and Soil C retained the least water’ Remember: Always link the soil property to the plant’s specific requirement
Mistake 11d: Giving a Conclusion Without Citing Experimental Evidence
Wrong: ‘Sandy soil is best for cacti because it drains quickly’ Correct: ‘Soil C collected the greatest volume (80 ml), showing it drained the fastest and retained the least water — making it most suitable for cacti’ Remember: Always cite the volumes collected from the experiment to support your conclusion
Mistake 11e: Calling a Producer “Prey” / Calling a Plant-Eating Animal a “Predator”
Wrong: ‘Grass is the prey of the rabbit’ or ‘The rabbit preys on grass’ Correct: ‘Grass is the producer. The rabbit is a consumer that feeds on grass.’ Remember: Prey = animal hunted by another animal. Predator = animal that hunts another animal. These terms do NOT apply to the plant-animal feeding relationship. Use ‘feeds on’ instead of ‘preys on’ when an animal eats a plant.
Mistake 9b: Misidentifying Producers as Consumers
Wrong: Listing a plant (e.g., grass, algae) as a consumer when asked ‘how many consumers are in this food web?’ Correct: Producers have NO arrows pointing toward them from other organisms. They make their own food and must be excluded from any list of consumers. Remember: Use the arrow-detection rule — only organisms with at least one incoming arrow are consumers. Eliminate all producers (no incoming arrows) first.
Mistake 11f: Analysing Cascading Effects Instead of Direct Relationships
Wrong: ‘The new eagle eats rabbits, so rabbits decrease, so foxes decrease, so deer increase, so…’ (tracing too many steps) Correct: Focus only on organisms that DIRECTLY feed on the same prey as the new organism Remember: Predict direct effects (one step away) and avoid trying to calculate knock-on effects further down the food web
Mistake 11g: Not Drawing Feeding Arrows Before Predicting Population Changes
Wrong: Trying to work out which populations are affected by looking at the food web in your head Correct: First draw the new organism’s feeding arrows into the food web diagram, then identify which existing predators now share the same prey Remember: The diagram makes it clear which organisms are now competing — then explain the effect using keywords
Mistake 11h: Incomplete Explanation of Deforestation and Soil Erosion
Wrong: ‘Deforestation causes soil erosion because there are no more roots to hold the soil’ (mentions only roots) Correct: ‘Deforestation causes soil erosion because (1) without leaves to slow down rainwater, the water hits the soil with greater force, and (2) without roots to anchor the soil, the soil is more easily washed away’ Remember: You MUST mention both plant parts and their separate roles — leaves reduce impact force of water; roots anchor the soil. Do not confuse or swap these two roles.
Mistake 11i: Not Identifying Upstream vs Downstream Before Comparing Sample Points
Wrong: Immediately concluding which location has more dissolved oxygen without checking the river flow direction. Correct: First establish which sample point is upstream (before the pollution source) and which is downstream (after the pollution source), then explain dissolved oxygen levels accordingly. Remember: Always trace the direction of river flow from the diagram or question before making any comparison.
Mistake 11j: Saying Pollution ‘Directly’ Reduces Oxygen Without Explaining the Bacteria Step
Wrong: ‘Water pollution reduces dissolved oxygen, killing fish.’ Correct: ‘Bacteria in the polluted water respire and decompose the waste, using up dissolved oxygen. The lower dissolved oxygen levels cause aquatic organisms to die.’ Remember: Full marks require the bacteria mechanism — waste → bacteria respire/decompose → dissolved oxygen decreases → organisms die.
Mistake 11k: Confusing Which Sample Point is Upstream or Downstream
Wrong: Assuming the first point labelled in a question (e.g., X) is always downstream or always has less oxygen. Correct: Read the diagram carefully to find the direction of water flow. The point before farms/villages/factories is upstream; the point after is downstream. Remember: X and Y are just labels — direction of flow determines which is upstream and which is downstream.
Mistake 12: Assuming Stripes Always Mean Camouflage
Wrong: ‘The fish has black stripes so it blends in with its surroundings’ Correct: Determine what the stripes actually do based on the animal’s habitat and behaviour. Stripes on an eye may reduce the eye’s visibility; stripes on a tail region combined with an eye-spot may misdirect predators. Stripes are not automatically camouflage. Remember: The function of any marking must be supported by context from the question, not assumed from how it looks.
Mistake 12b: Attributing a Feature to a Function Without Evidence
Wrong: ‘The fish’s flat body helps it camouflage against the seafloor’ (if no evidence is given that it lives on the seafloor) Correct: Use only the habitat and behaviour information provided. If the question states the fish lives in coral reefs and feeds in crevices, a flat body helps it squeeze through gaps to find food. Remember: Every stated function must be justified by specific information from the question.
Mistake 13: Only Thinking of Predator Avoidance When Describing Survival
Wrong: ‘All adaptations help animals hide from or escape predators’ Correct: Adaptations can help with finding food, reproducing, or surviving extreme temperatures/conditions — not only predator avoidance. Remember: When asked ‘how does this feature help the animal survive?’, consider all four survival needs: food, predators, reproduction, and environment.
Mistake 13b: Applying the Wrong Concept
Wrong: Explaining a plant’s adaptations to being under the sun by talking about light intensity for photosynthesis, when the question is about surviving heat and water loss. Correct: Identify the specific condition in the question (e.g., high temperature, dry environment) and choose the matching concept (heat transfer, water loss) — not just any concept that involves the same organism. Remember: Read the question carefully. The environment described (cold water, direct sunlight, desert, rainforest) tells you which concept to use.
Mistake 13c: Skipping the Comparison When Asked
Wrong: Explaining only one organism’s adaptation when the question says ‘compare’ or asks about two different environments. Correct: Explicitly state what is different about each environment and explain why each difference leads to a different adaptation or requires a different explanation. Remember: The word ‘compare’ means you must address BOTH sides. State the difference in environment AND the difference in adaptation.
Mistake 13d: Giving a Shallow Mechanism
Wrong: ‘The polar bear has thick fur to keep it warm.’ Correct: ‘The polar bear has thick fur which traps air between the hairs. Air is a poor conductor of heat, so less heat is lost from the body, keeping the polar bear warm in the cold Arctic.’ Remember: ‘Keeps it warm’ is not an explanation — it is a restatement of the purpose. You must explain the physical or biological process that achieves the purpose.
Mistake 14: Describing Data Without Comparing Across Conditions
Wrong: ‘The mass of the stone from Location B did not change much’ Correct: ‘The mass of the stone from Location B decreased by only 0.2 g, which is less than the decrease of 1.5 g for Location A, showing that rainwater from Location A is more acidic’ Remember: Always compare the result to results from other locations or conditions — never describe one result in isolation
Mistake 15: Not Stating the Changed Variable When Explaining a Fair Test
Wrong: ‘We use the same volume of rainwater to make it a fair test’ Correct: ‘We use the same volume of rainwater for each set-up so that volume is not a variable. The only variable that is changed is the location from which the rainwater is collected’ Remember: A fair-test explanation must identify WHAT is kept the same AND state that only ONE variable is changed
Mistake 16: Describing Acid Rain Effects Without Linking Cause to Effect
Wrong: ‘The aquatic organisms died’ Correct: ‘The acid rain collected in the water body, causing the water to become acidic. Aquatic organisms that could not adapt to the increased acidity died’ Remember: Always link the cause (acid rain / increased acidity) explicitly to the effect (corrosion / organism death)
Exam Tips
Keywords to Include in Answers
For Food Chains/Webs:
- “Energy flows from…”
- “The producer is…”
- “The primary/secondary/tertiary consumer…”
- “The arrows show the direction of energy flow”
- “The arrows point from the organism being eaten to the organism doing the eating”
For Population Changes:
- “The population will increase/decrease”
- “More/less food available”
- “Cannot get enough energy”
- “Alternative food sources”
- “Competition for food”
- Use “feeds on” (not “preys on”) when describing an animal eating a plant
- ‘With the addition of [organism], there are more predators feeding on [prey]’
- ‘Organisms [X] and [Y] are competing to feed on [food source]’
- ‘Less food available / will die of starvation’
- ‘More predators feeding on [prey], so population of [prey] decreases’
- ‘dissolved oxygen’
- ‘bacteria respire / decompose’
- ‘upstream / downstream’
- ‘direction of river flow’
For Adaptations:
- “This adaptation helps the organism…”
- “Allows it to survive by…”
- “Helps it find/catch food”
- “Protects it from predators”
- “Helps it survive in its habitat”
For Man’s Impact:
- “Loss of habitat”
- “Disruption of food chains/webs”
- “Species may become extinct”
- “Pollution affects…”
- “Conservation efforts include…”
- ‘leaves slow down the flow of rainwater / reduce the impact force of water’
- ‘roots anchor the soil / hold the soil in place’
- ‘soil erosion’
- ‘more vegetation = less soil erosion’
- ‘acid rain forms when rainwater mixes with pollutants’
- ‘corrodes buildings/structures’
- ‘water habitat becomes acidic’
- ‘cannot adapt to the increased acidity’
- ‘only one variable is changed’
Note: For deforestation + soil erosion questions, always structure your answer in two parts: first explain the role of leaves (impact force), then explain the role of roots (anchoring). Identify the changed variable first, then trace the mechanism through each plant structure.
Soil Questions
3-step framework for soil suitability questions:
- Plant requirement — State what type of soil the plant needs (e.g., cacti need well-draining soil because they grow in deserts)
- Experimental evidence with specific volumes — State which soil collected the greatest/least volume and what this means (e.g., ‘Soil C collected 80 ml, the greatest volume of all three soils, meaning it retained the least water’)
- Soil structure with superlative language — Explain why using particle/air space language (e.g., ‘Soil C has the largest air spaces, allowing water to drain through it the fastest’)
Key reminders:
- Always use superlative/comparative language for ‘most suitable’ questions: most/least/greatest/smallest
- Compare ALL soils listed, not just the chosen one
- Always link soil property to plant requirement
Example model answer: ‘Cacti require soil that retains little water because they grow in deserts. Soil C collected the greatest volume of water (X ml), meaning it retained the least water of the three soils. Soil C has the largest air spaces between particles, which allows water to drain through it fastest. Therefore Soil C is most suitable for planting cacti.’
Mark-Earning Phrases
2-mark questions typically require:
- State the fact (1 mark)
- Explain why/how (1 mark)
Example: “The grasshopper population will increase (1 mark) because there are fewer birds to eat them (1 mark).”
For “Explain” questions:
- Use “because,” “therefore,” “this causes,” “as a result”
- Link cause and effect clearly
- Example: “Cutting down forests removes habitats for animals. This causes animal populations to decrease because they cannot find food and shelter.”
For adaptation questions:
- Name the adaptation
- State how it works
- Link to survival (food/protection/habitat)
- Example: “The cactus has a thick stem that stores water. This helps the cactus survive in the desert where there is very little rainfall.”
Common Question Types and How to Answer
Type 1: “What happens if [organism] is removed?”
- State effect on its prey (will increase)
- State effect on its predator (will decrease)
- Mention food/energy in your explanation
- Consider alternative food sources if mentioned in food web
Type 2: “How does [adaptation] help the organism?”
- Describe what the adaptation is
- Explain how it functions
- Link to either: finding food, avoiding predators, or surviving in habitat conditions
- Also consider: reproduction (e.g. bright colours to attract mates) as a survival function
- Use context from the question to decide which function applies — do not assume based on the feature’s appearance alone
- If an eye-spot is described, state it ‘redirects predator attacks toward a less vital part of the body’ — not that it provides camouflage
- Use specific examples
Type 3: “Draw arrows to complete the food chain/web”
- Remember: arrows go FROM eaten organism TO eating organism
- Check that producers are eaten by herbivores
- Check that herbivores are eaten by carnivores
- Don’t draw arrows going backwards
Type 4: “Describe the impact of [human activity]”
- State the activity
- State immediate effect on habitat/organisms
- State long-term consequence (population change, extinction, pollution)
- Mention effect on food chains if relevant
Type 5: ‘What happens if [new organism] is introduced into this food web?’
- Step 1: Draw the new organism’s feeding arrows into the diagram
- Step 2: Identify which existing predators now share the same prey (competitors)
- Step 3: State that the shared prey population decreases (more predators eating them)
- Step 4: State that the competing predators’ populations also decrease (less food, starvation)
- Use the sentence structure: 'With the addition of [organism], there are more predators feeding on [prey]. The population of [prey] decreases. Organisms [X] and [Y] are competing to feed on [prey], so [X]‘s population also decreases.’
- Do NOT try to trace effects beyond the direct relationships
Type 5b: ‘How many consumers are in this food web?’ or ‘Identify all consumers’
- Step 1: Apply the producer elimination rule — find organisms with NO incoming arrows and cross them off (these are producers)
- Step 2: Every remaining organism (those with at least one incoming arrow) is a consumer
- Step 3: Count carefully — complex food webs can have organisms connected to multiple chains
- Tip: Use the exact definition — a consumer ‘cannot produce its own food and must obtain energy from plants or animals’
Type 5c: ‘Identify the predators / prey in this food web’
- Remember: predators and prey are ONLY animals in an animal-eats-animal relationship
- Plants/producers are NEVER prey, even though animals eat them
- Support your identification by referencing the feeding arrows in the diagram provided
Recall definitions first — before answering any food web question, mentally check the definitions of producer, consumer, predator, and prey so you apply the correct terms. Then identify which organisms in the diagram fit each definition before writing your answer.
Answer Structure for Long Questions
Use P.E.E. Structure:
- Point: Make your statement
- Explanation: Explain why/how
- Example: Give specific example if needed
Example: “Deforestation negatively affects the environment (Point). When forests are cut down, animals lose their habitats and cannot find food and shelter (Explanation). For example, if all trees are removed, birds that nest in trees will have nowhere to live and their population will decrease (Example).”
Adaptations-Specific Strategy
Step 1 — Spot the environment keyword: Before writing anything, underline words that describe the environment: cold water, direct sunlight, desert, rainforest, open ocean, dark forest floor. This keyword tells you which cross-topic concept to use.
Step 2 — Choose your concept:
| Environment keyword | Likely concept needed |
|---|---|
| Cold / Arctic / deep water | Heat transfer (reducing heat loss) |
| Hot / under the sun | Heat transfer (preventing overheating) + water loss |
| Dry / desert | Water conservation / water loss |
| Low light / shaded / deep water | Photosynthesis / light absorption |
| Fast-moving water / flight | Forces / streamlining / drag |
Step 3 — Filter your answer: Only use the concept that matches the environment keyword. Do not include all the concepts you know — select the one or two that are most directly relevant.
Step 4 — When the question asks you to compare: Explicitly name the difference in environment between the two cases, then explain why that difference leads to a different adaptation. Use a parallel structure: ‘In [Environment A], [Organism/Feature] does/has [X] because [reason]. In [Environment B], [Organism/Feature] does/has [Y] because [different reason].’
Water Pollution — Step-by-Step Answer Framework
For questions comparing dissolved oxygen levels at two points along a river:
Step 1 — Establish flow direction: Identify which sample point is upstream (before pollution sources) and which is downstream (after pollution sources).
Step 2 — Explain the biological mechanism: Animal waste and sewage contain bacteria. These bacteria respire and decompose the waste, consuming dissolved oxygen from the water.
Step 3 — State the consequence: The downstream location has lower dissolved oxygen levels because bacteria have used it up. Aquatic organisms downstream die as a result.
Example 2-mark answer: ‘Location Y (downstream, after the farms and village) has less dissolved oxygen (1 mark) because bacteria in the animal waste and sewage respire and decompose the waste, using up the dissolved oxygen in the water (1 mark).’
Acid Rain and Fair Test Questions
For fair test questions:
- Identify the ONE changed variable
- Use the phrase: ‘only one variable is changed’
- State what is kept the same and WHY (e.g., ‘same volume so that volume is not a variable’)
- Example: ‘The same volume of rainwater is used for each set-up so that volume is not a variable. The only variable that is changed is the location of the rainwater.’
For data interpretation questions (acid rain):
- Compare results across ALL conditions/locations — never describe just one
- Structure: (1) State the changed variable → (2) Compare all results → (3) Link to scientific concept
- Example structure: ‘The rainwater from Location A caused the greatest decrease in stone mass (1.5 g), compared to Location B (0.2 g) and Location C (0.8 g). This shows that rainwater from Location A is the most acidic, causing the highest rate of corrosion.’
Keywords to use:
- ‘only one variable is changed’
- ‘compared to’
- ‘the most/least acidic’
- ‘rate of corrosion’
- ‘cannot adapt to the increased acidity’
Words That Signal What to Do
- Identify/State/Name: Just give the answer (usually 1 mark)
- Describe: Give details about what it is
- Explain: Give reasons using “because” or “therefore”
- Compare: Show similarities AND differences
- Predict: Say what will happen and explain why
- Suggest: Give an idea and explain why it would work
Quick Summary
Food Chains and Food Webs - Must Know:
- ☑ Sun is the ultimate source of energy for most living things on Earth
- ☑ Producers (green plants) make their own food through photosynthesis
- ☑ Consumers cannot make their own food: Herbivores eat plants, Carnivores eat animals, Omnivores eat both
- ☑ Energy flows in ONE direction: Sun → Producer → Primary Consumer → Secondary Consumer → Tertiary Consumer
- ☑ Arrows in food chains point FROM the organism being eaten TO the organism eating it
- ☑ Decomposers break down dead organisms and return nutrients to the soil
- ☑ Food webs show interconnected food chains; most animals eat more than one type of food
- ☑ Removing one organism from a food web affects multiple other organisms
Predator-Prey Relationships - Must Know:
- ☑ Predator hunts and eats prey; prey is hunted and eaten
- ☑ When prey population increases → predator population increases (more food available)
- ☑ When predator population increases → prey population decreases (more prey eaten)
- ☑ Population sizes of predators and prey follow a cycle and affect each other
- ☑ One organism can be both predator and prey in different relationships
Adaptations - Must Know:
- ☑ Adaptations are special features or behaviors that help organisms survive
- ☑ Structural adaptations include: sharp claws/teeth (catching food), camouflage (hiding), thick fur (warmth), waxy leaves (reduce water loss)
- ☑ Behavioral adaptations include: migration, hibernation, nocturnal behavior
- ☑ Predators have adaptations for hunting: forward-facing eyes, sharp claws/teeth, speed, good senses
- ☑ Prey have adaptations for escaping: camouflage, speed, warning coloration, armor/spines
- ☑ Always explain HOW an adaptation helps survival (link to food, protection, or habitat)
- ☑ Survival needs include: finding/catching food, avoiding predators, reproduction, and coping with harsh conditions — always consider all four, not just predator avoidance
- ☑ Eye-spot markings (dark spot with white ring, often near the tail) deceive predators by redirecting attacks away from the real head — describe as ‘redirecting/deceiving predators’, not camouflage
- ☑ The function of any marking (stripes, spots, colour patterns) must be determined from the organism’s habitat and behaviour — never assume stripes mean camouflage
The Carbon Cycle - Must Know:
- ☑ Carbon cycle describes how carbon moves between the atmosphere, living organisms, and the environment
- ☑ Photosynthesis removes CO₂ from the atmosphere (plants absorb CO₂ to make glucose)
- ☑ Respiration releases CO₂ into the atmosphere (all organisms release CO₂)
- ☑ Decomposition releases CO₂ as decomposers break down dead organisms
- ☑ Burning fossil fuels releases stored carbon back into the atmosphere as CO₂
- ☑ Deforestation disrupts the carbon cycle by reducing the number of plants absorbing CO₂
- ☑ Too much CO₂ in atmosphere = greenhouse effect → global warming
Man’s Impact - Must Know:
- ☑ Negative impacts: Deforestation (habitat loss, extinction), Air pollution (breathing problems, global warming), Water pollution (death of aquatic life), Land pollution (soil contamination)
- ☑ Deforestation causes loss of habitat, disrupted food chains, and possible extinction
- ☑ Deforestation increases soil erosion by removing (1) leaf canopy — leaves normally slow rainwater and reduce water impact force on soil, and (2) root systems — roots anchor soil and prevent it from being washed away
- ☑ Two factors determine amount of soil erosion: impact force of water hitting soil, and how anchored the soil is
- ☑ More vegetation = less soil erosion; fewer plants = greater soil erosion
- ☑ Pollution harms organisms and disrupts ecosystems
- ☑ Overfishing and overhunting reduce populations and disrupt food chains
- ☑ Positive actions: Conservation (nature reserves, protecting habitats), Reforestation (planting trees), Reduce pollution (cleaner energy, recycling), Breeding programs for endangered species
- ☑ The 3Rs: Reduce, Reuse, Recycle help protect the environment
- ☑ Sustainable practices ensure resources are available for the future
Final Revision Checklist:
- ✓ Can you draw a food chain with correct arrow directions?
- ✓ Can you explain what happens when one organism is removed from a food web?
- ✓ Can you identify and explain predator-prey population cycles?
- ✓ Can you name and explain adaptations for predators and prey?
- ✓ Can you describe negative human impacts on the environment?
- ✓ Can you suggest ways humans can help protect the environment?
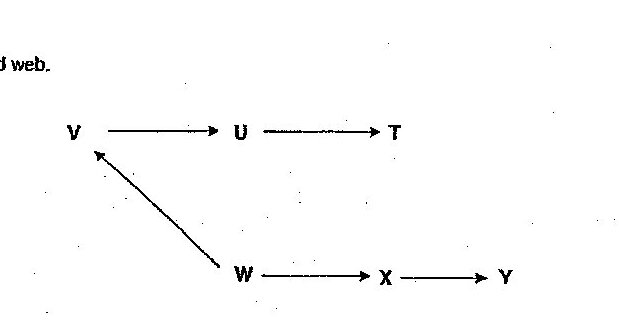
Study the food web. Based on the food web, which organisms will be affected immediately when all of organism U die?
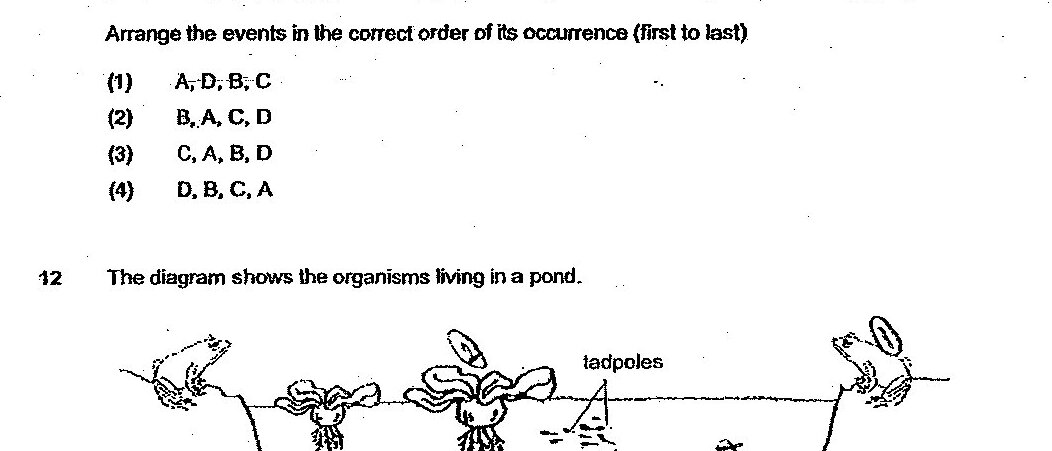
A farmer used a certain amount of fertiliser on his farm. Some of this fertiliser flowed into a nearby river which contained some bacteria, plants and fish. The water in the river became very murky and a number of events happened after that. The table shows the events that happened in the river after that but they are not in the correct order. Arrange the events in the correct order of its occurrence (first to last)
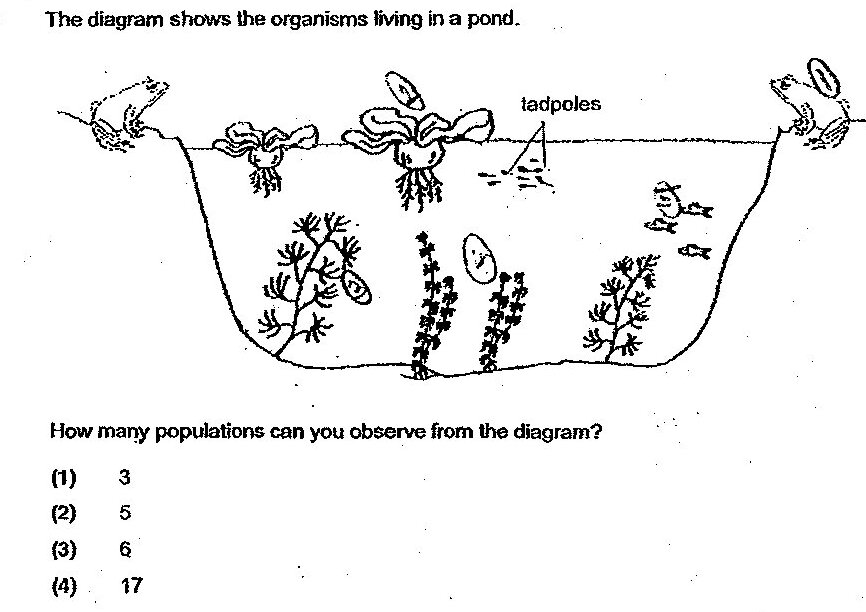
The diagram shows the organisms living in a pond. How many populations can you observe from the diagram?
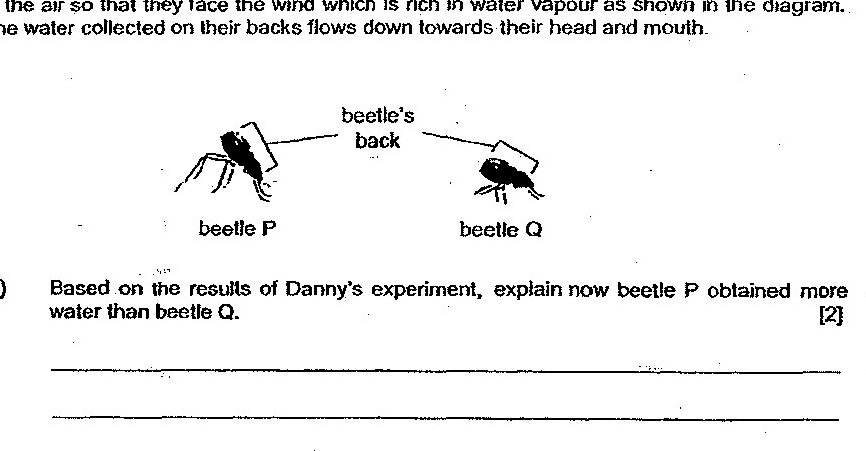
Based on the results of Danny's experiment, explain how beetle P obtained more water than beetle Q.
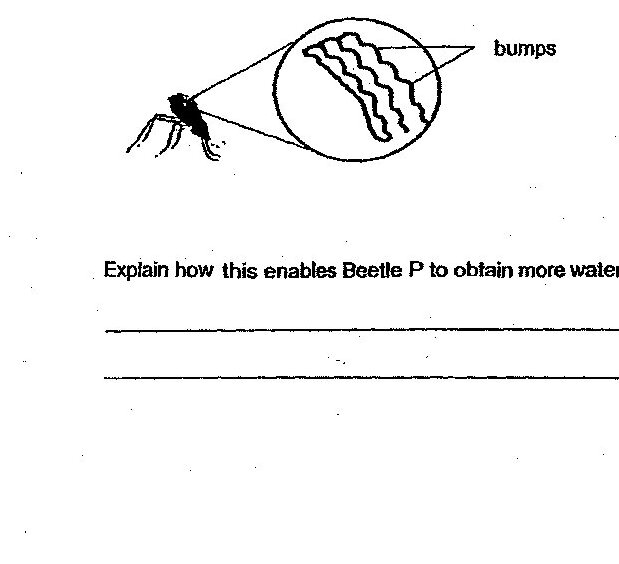
In addition, it was observed that Beetle P's back also has many bumps as shown in the diagram. Explain how this enables Beetle P to obtain more water from the environment?
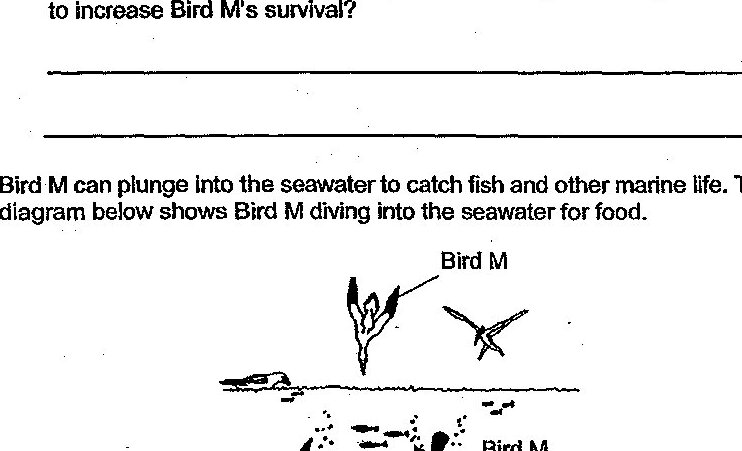
Based on the diagram above, state a structural adaptation of Bird M and suggest how the structural adaptation helps in its hunt for fish and other marine life.
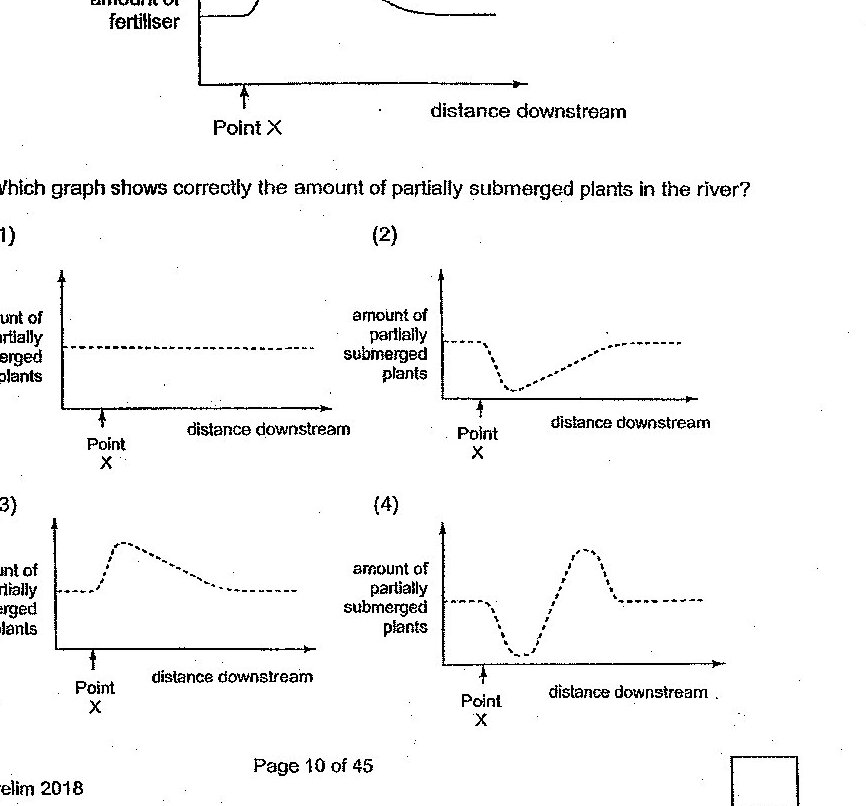
A farm next to a river releases fertiliser into the river at point X. Which graph shows correctly the amount of partially submerged plants in the river?
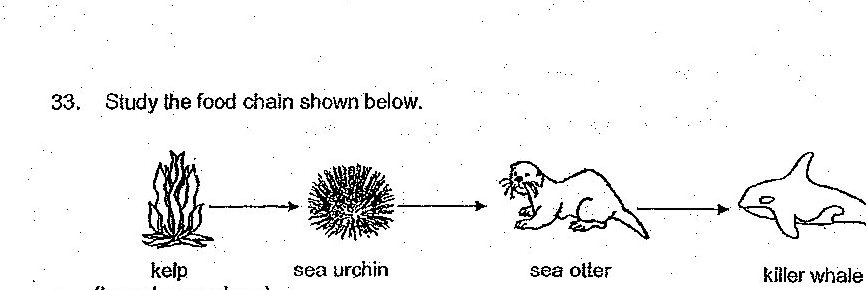
Based on food chain 1, explain how the sea otters are important to the survival of several marine organisms.
Using the two conditions given in the article, explain how deforestation can cause coral bleaching.
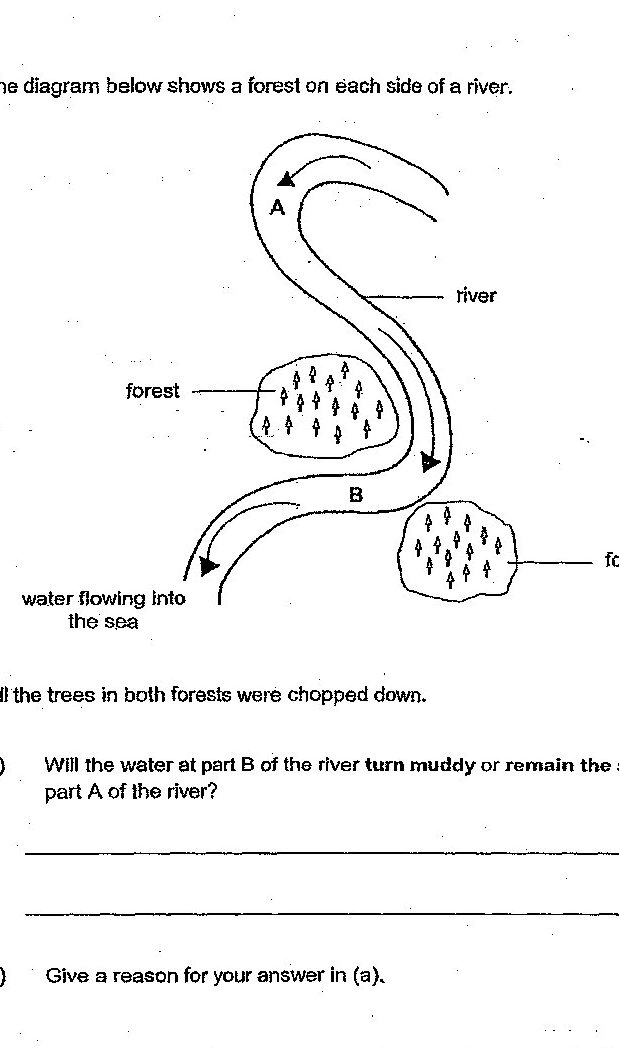
Besides having large broad leaves, explain how the presence of the ants may ensure that plant X grows healthily.
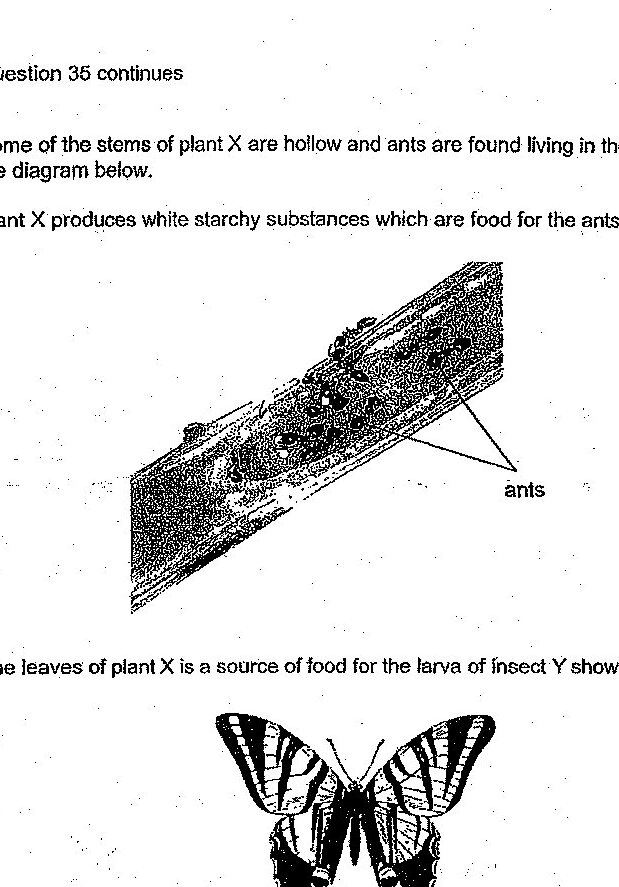
Explain how these structural adaptations enhance the survival of plant R.
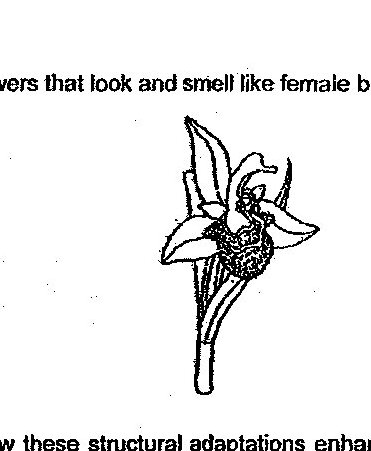
Explain how animal Q, by building its nest near plant R, can enhance its own survival.
With animal Q living in the same habitat, how would the population of plant R change after some time? Explain your answer.
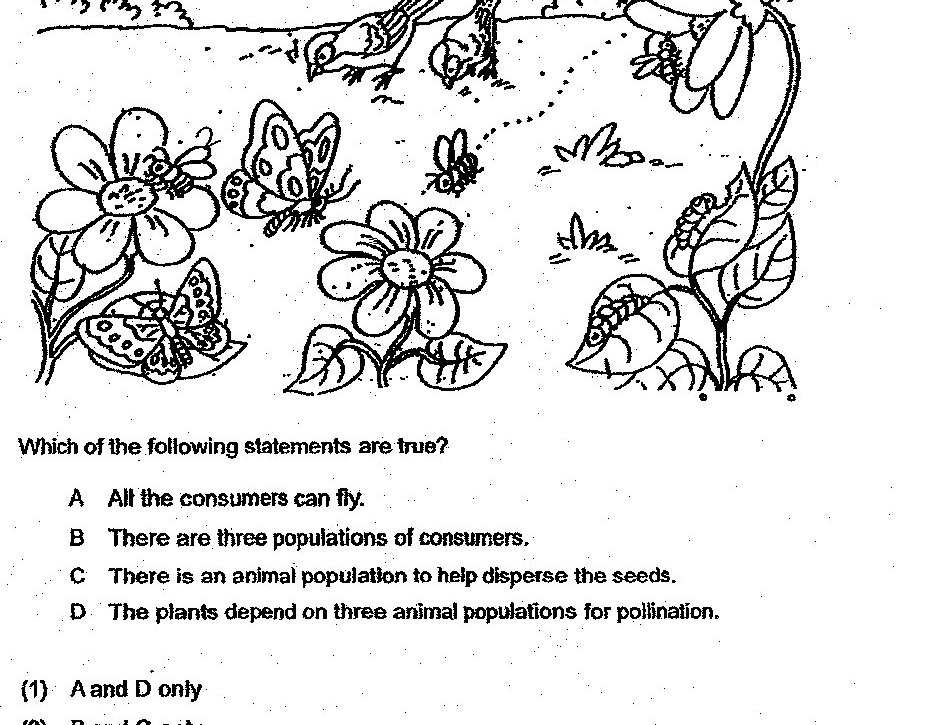
The diagram below shows the organisms in a garden. Which of the following statements are true? A All the consumers can fly. B There are three populations of consumers. C There is an animal population to help disperse the seeds. D The plants depend on three animal populations for pollination.
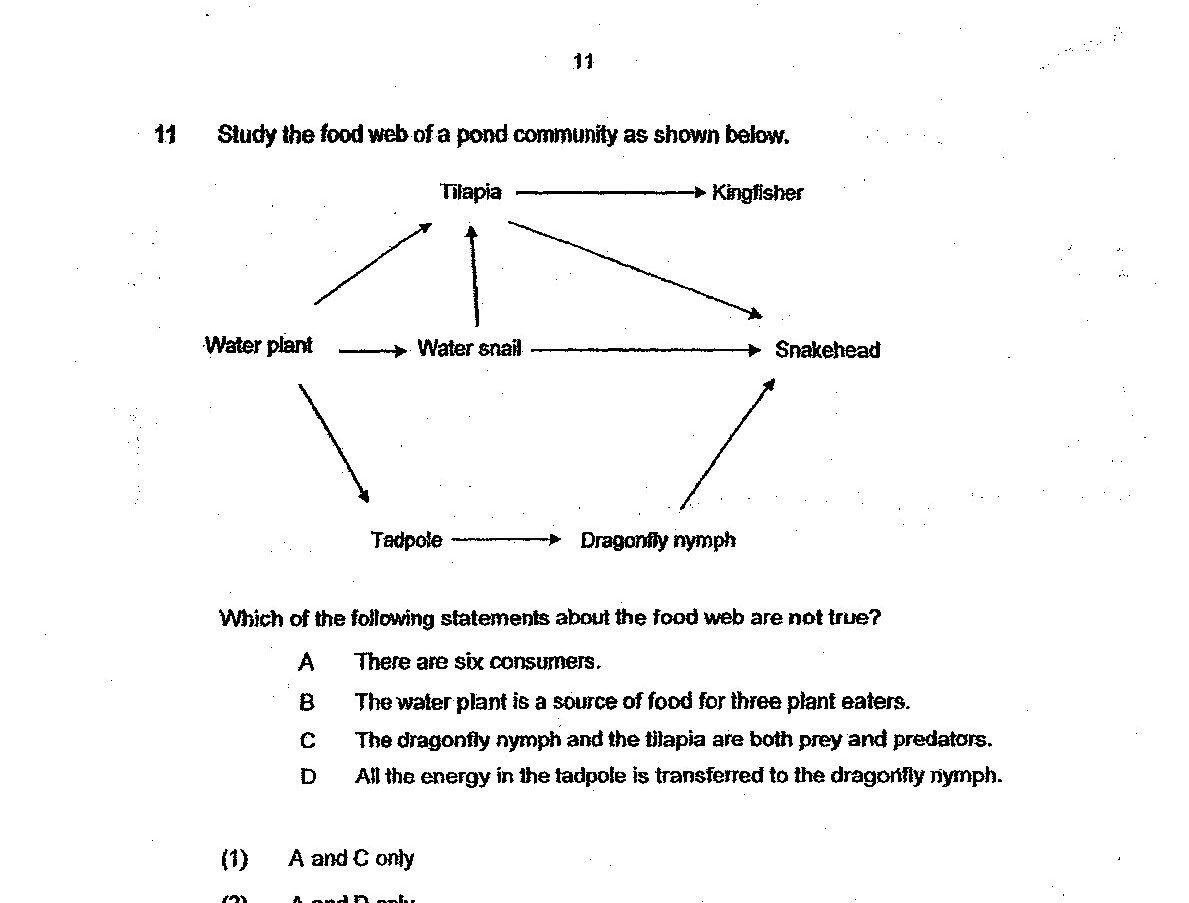
Study the food web of a pond community as shown below. Which of the following statements about the food web are not true?
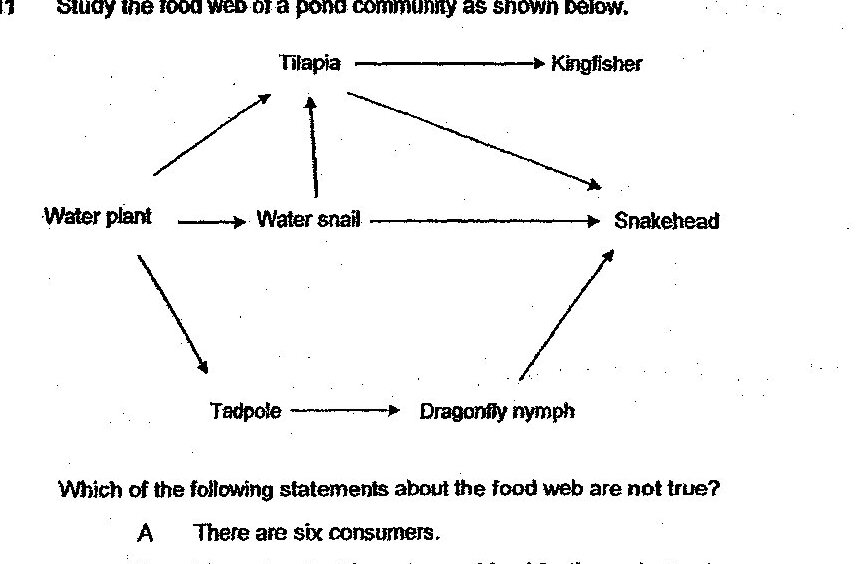
Which statements about the food web are not true? (Answer options)
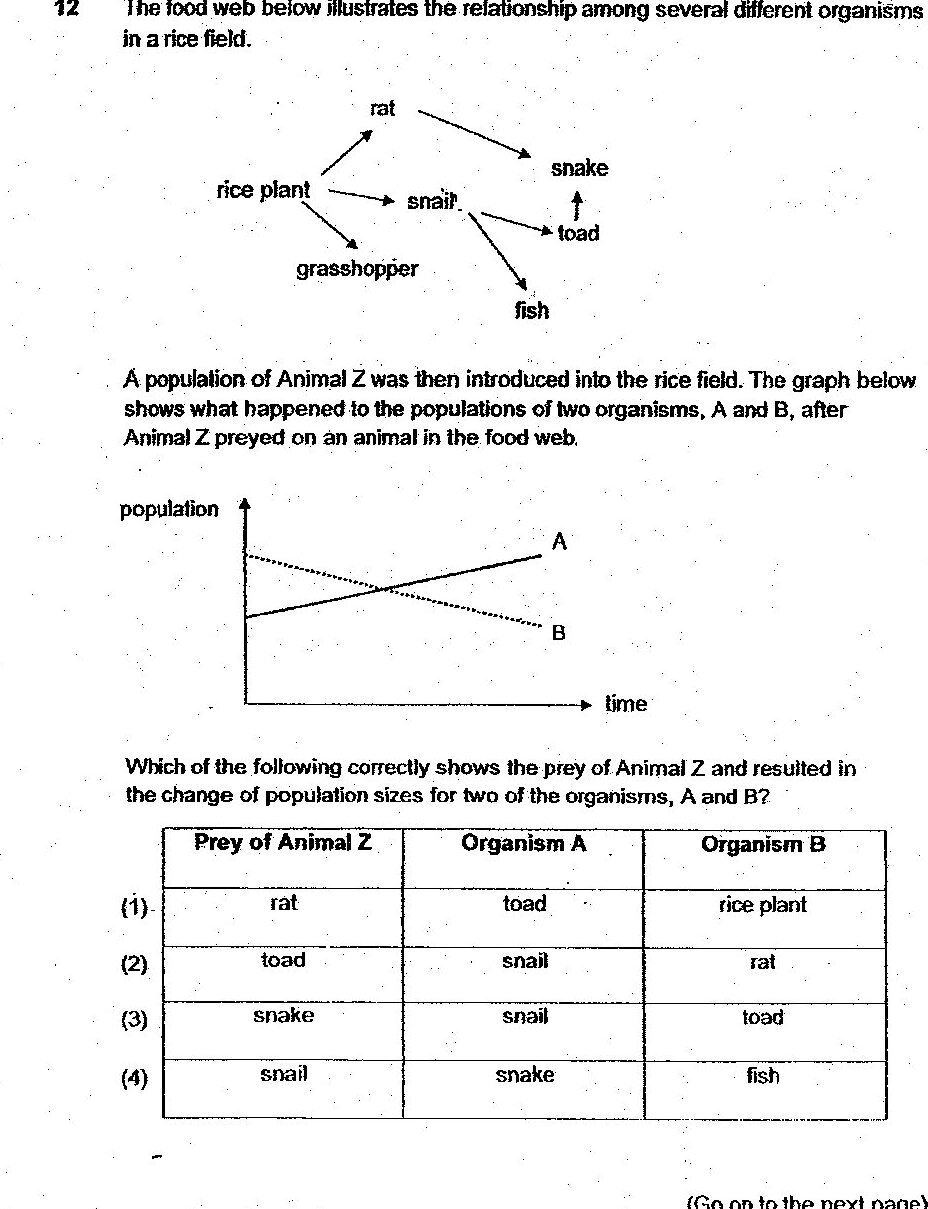
The food web below illustrates the relationship among several different organisms in a rice field. A population of Animal Z was then introduced into the rice field. The graph below shows what happened to the populations of two organisms, A and B, after Animal Z preyed on an animal in the food web. Which of the following correctly shows the prey of Animal Z and resulted in the change of population sizes for two of the organisms, A and B?
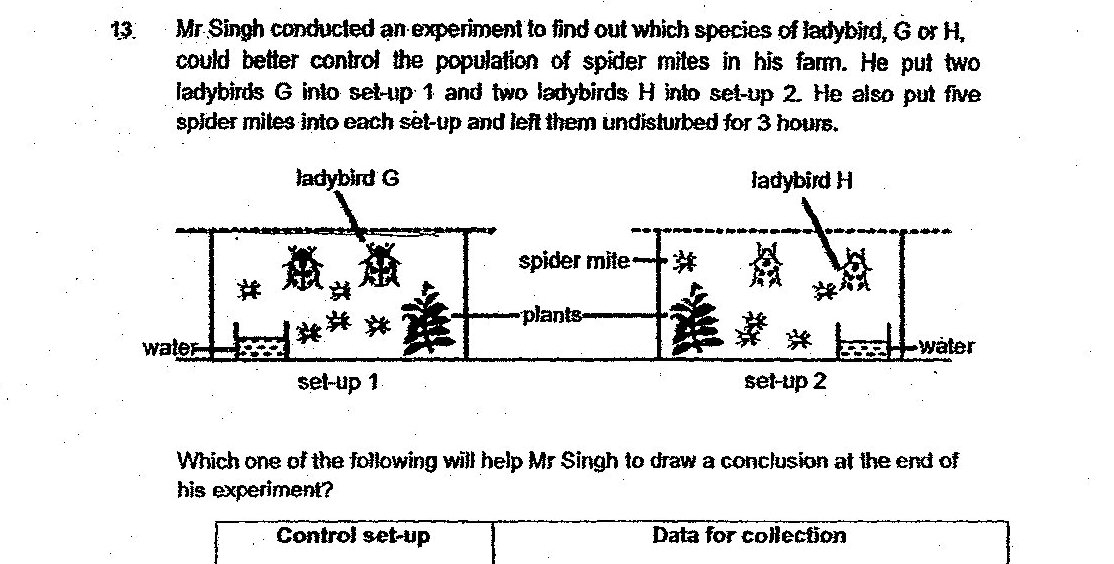
Mr Singh conducted an experiment to find out which species of ladybird, G or H, could better control the population of spider mites in his farm. He put two ladybirds G into set-up 1 and two ladybirds H into set-up 2. He also put five spider mites into each set-up and left them undisturbed for 3 hours. Which one of the following will help Mr Singh to draw a conclusion at the end of his experiment?
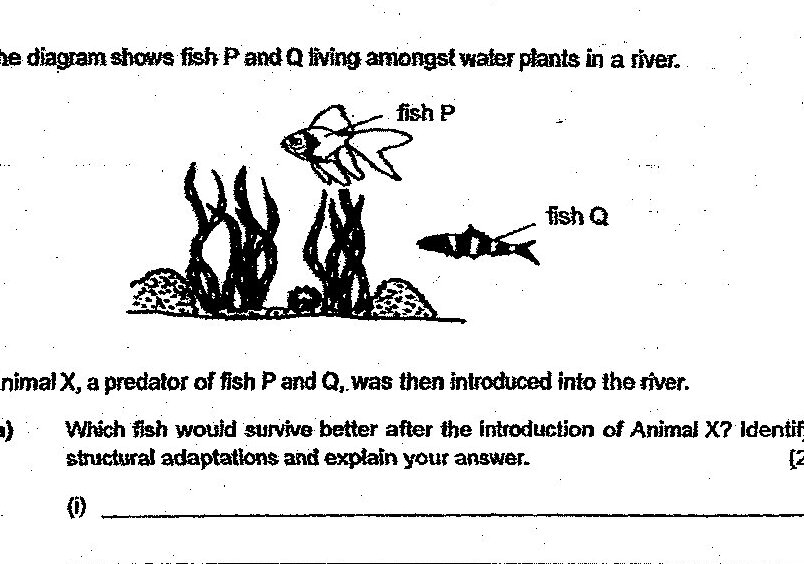
Which fish would survive better after the introduction of Animal X? Identify two structural adaptations and explain your answer.
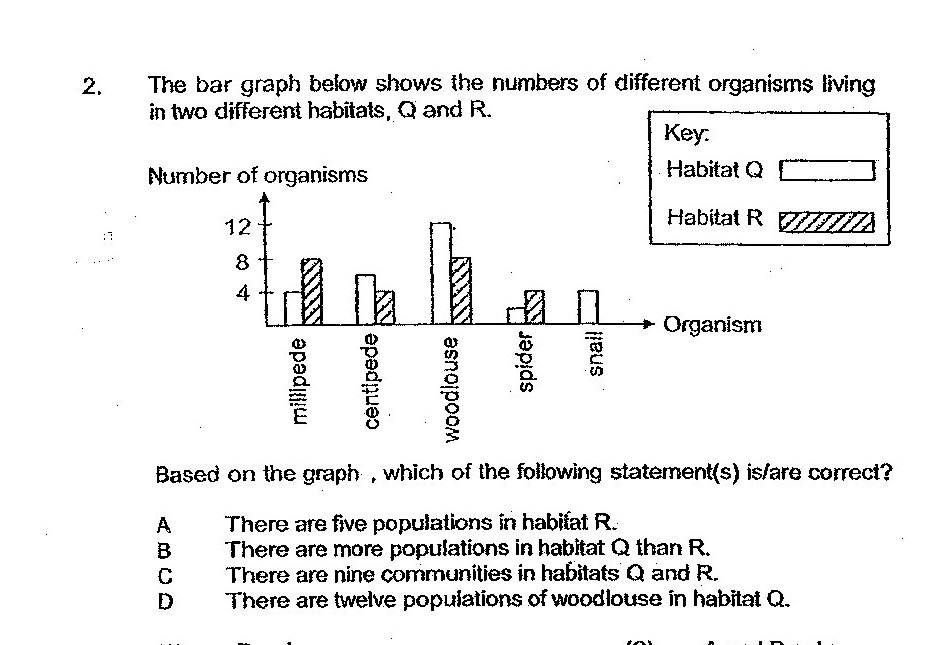
Which answer choice is correct?
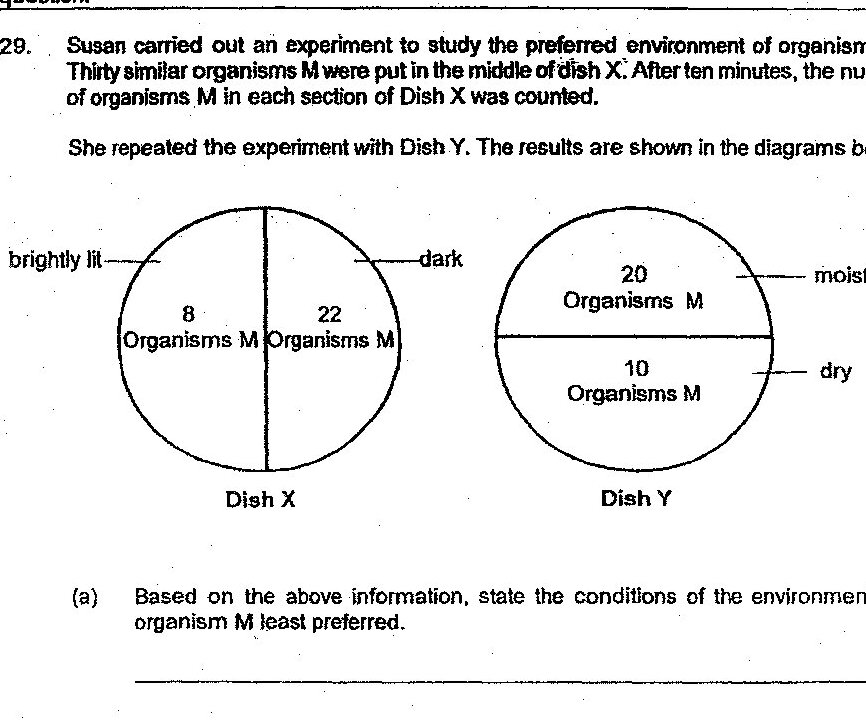
Based on the above information, state the conditions of the environment that organism M least preferred.
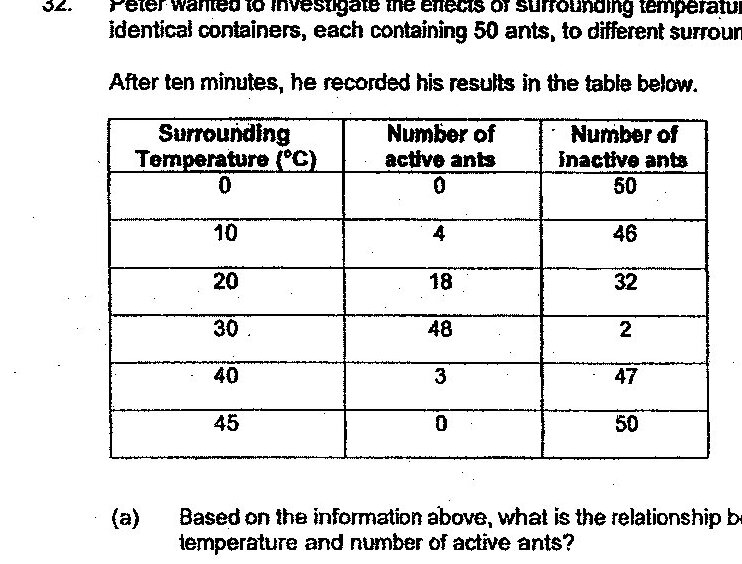
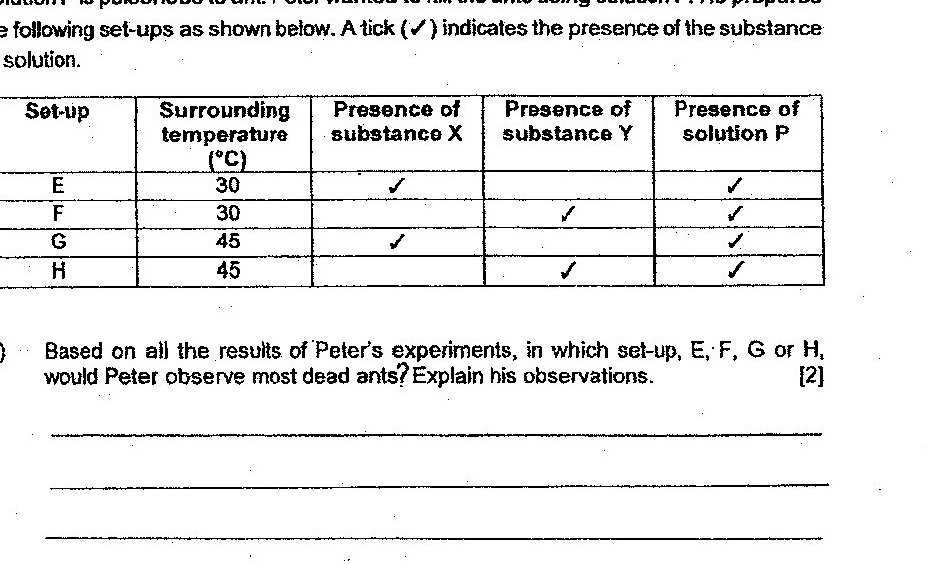
Based on the information above, what is the relationship between the surrounding temperature and the number of active ants?
Based on all the results of Peter's experiments, in which set-up, E, F, G or H, would Peter observe most dead ants? Explain his observations.
Based on the information above, identify a structural adaptation that enables it to swim well. Explain how it enables animal X to swim well.
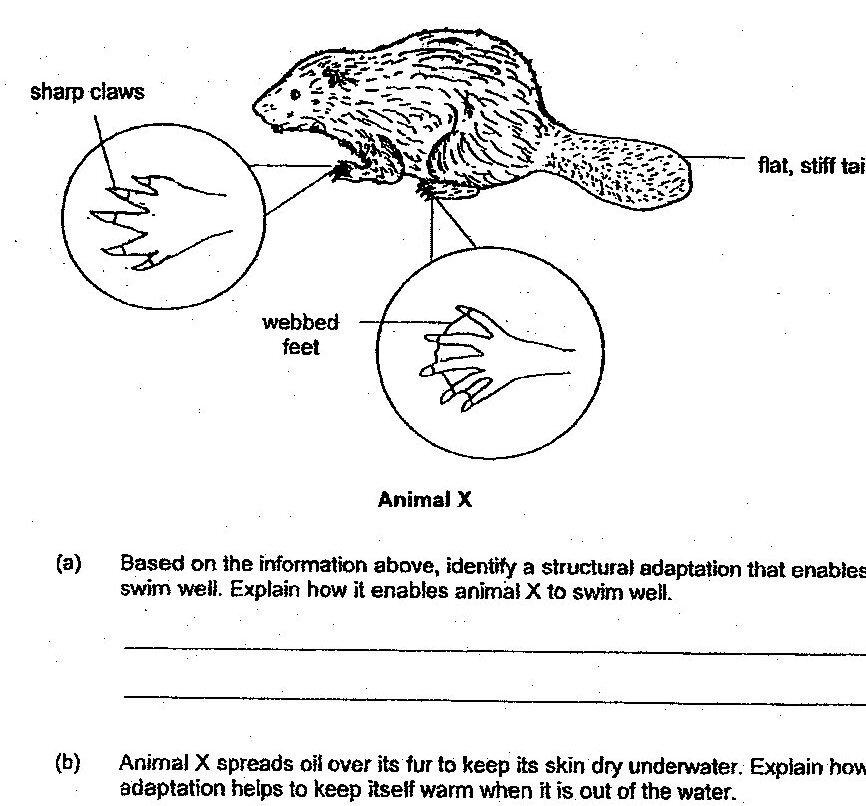
Animal X spreads oil over its fur to keep its skin dry underwater. Explain how this adaptation helps to keep itself warm when it is out of the water.
Animals A and B depend on each other in a habitat. Some information about the habitat are given below: • ticks are insects that feed on the blood of animal B which they live on • animal A eats ticks • animal B is a plant-eater (a) How do animal A and animal B benefit from the relationship above?
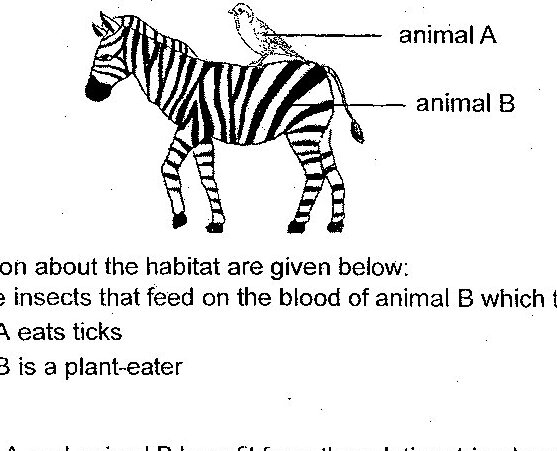
Benefit for animal A:
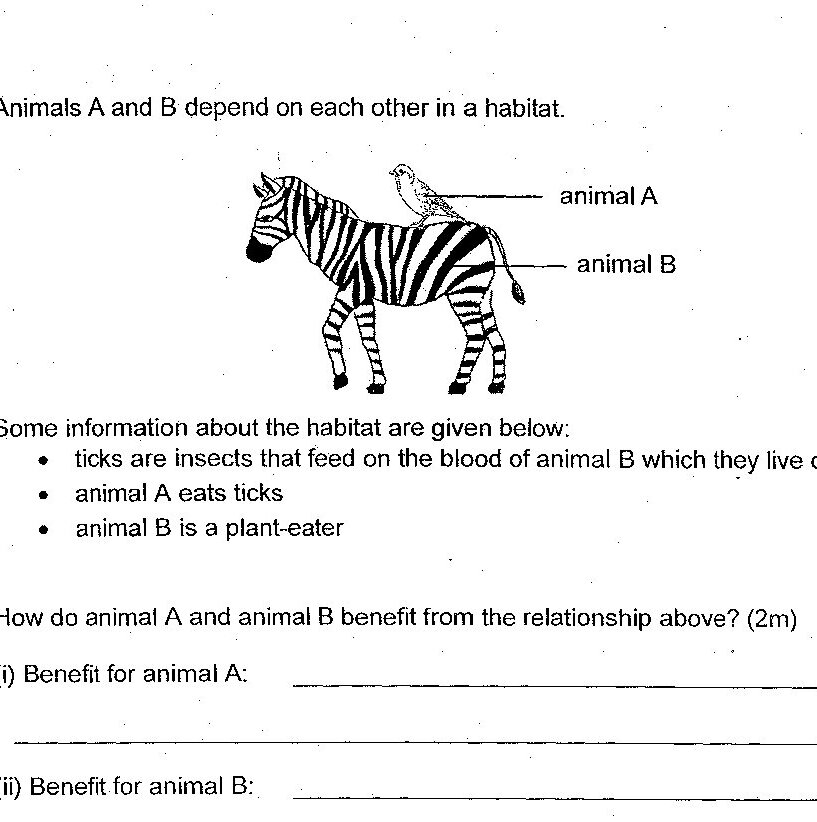
Benefit for animal B:
Past year papers cover the full exam — browse by subject below.
View All Papers ›