Systems P6 PSLE Science

Circulatory System

Circulatory System - Complete Study Notes

Key Concepts

Heart and Blood Vessels

The Heart

  • The heart is a muscular organ about the size of your fist that pumps blood throughout the body
  • It is located in the chest, slightly to the left side, protected by the rib cage
  • The heart beats continuously (about 70-80 times per minute at rest for children)
  • It has four chambers: two upper chambers (atria) and two lower chambers (ventricles)
  • The heart muscle contracts and relaxes rhythmically to pump blood
  • This pumping action creates your pulse, which you can feel at your wrist or neck

Blood Vessels There are three main types of blood vessels:

  1. Arteries

    • Carry blood away from the heart
    • Have thick, muscular, elastic walls to withstand high pressure
    • Blood flows rapidly under high pressure
    • Most arteries carry oxygen-rich blood (bright red)
    • Exception: Pulmonary artery carries oxygen-poor blood from heart to lungs
  2. Veins

    • Carry blood back to the heart
    • Have thinner walls than arteries (blood flows under lower pressure)
    • Blood flows more slowly
    • Most veins carry oxygen-poor blood (dark red)
    • Exception: Pulmonary vein carries oxygen-rich blood from lungs to heart
    • Contain valves to prevent backward flow of blood
  3. Capillaries

    • Tiny, microscopic blood vessels
    • Connect arteries to veins
    • Have very thin walls (only one cell thick)
    • Allow exchange of materials (oxygen, carbon dioxide, nutrients, waste products) between blood and body cells
    • Found in all body tissues

Functions of Blood

Blood performs four main functions in the body:

  1. Transport of Oxygen

    • Red blood cells contain haemoglobin, which binds with oxygen
    • Carries oxygen from the lungs to all body cells
    • Oxygen is needed for cells to release energy from food
  2. Transport of Carbon Dioxide

    • Carries carbon dioxide (waste product) from body cells to the lungs
    • Carbon dioxide is then breathed out
  3. Transport of Digested Food (Nutrients)

    • Carries digested food substances (glucose, amino acids, fatty acids, vitamins, minerals) from the small intestine to all body cells
    • Nutrients are used for energy, growth, and repair
  4. Transport of Waste Products

    • Carries waste products (like urea) from body cells to the kidneys
    • Kidneys filter out these wastes, which leave the body as urine

Additional Functions:

  • Protection: White blood cells fight germs and diseases
  • Regulation of body temperature: Blood distributes heat throughout the body
  • Clotting: Platelets help blood clot to seal wounds and stop bleeding

Blood Circulation

The Two Circulation Pathways:

  1. Circulation to the Lungs (Pulmonary Circulation)

    • Heart → Pulmonary artery → Lungs → Pulmonary vein → Heart
    • Oxygen-poor blood flows from the heart to the lungs
    • In the lungs: Carbon dioxide is removed, oxygen is absorbed
    • Oxygen-rich blood returns to the heart
  2. Circulation to the Body (Systemic Circulation)

    • Heart → Aorta (main artery) → Arteries → Capillaries in body tissues → Veins → Heart
    • Oxygen-rich blood flows from the heart to all parts of the body
    • In body tissues: Oxygen and nutrients are delivered, carbon dioxide and waste products are collected
    • Oxygen-poor blood returns to the heart

Complete Blood Circulation Path:

  1. Oxygen-poor blood enters the heart from the body
  2. Heart pumps this blood to the lungs (through pulmonary artery)
  3. In the lungs, blood picks up oxygen and releases carbon dioxide
  4. Oxygen-rich blood returns to the heart (through pulmonary vein)
  5. Heart pumps this oxygen-rich blood to all parts of the body (through aorta and arteries)
  6. Blood delivers oxygen and nutrients to cells, collects carbon dioxide and wastes
  7. Blood returns to the heart through veins
  8. The cycle repeats continuously

Key Points:

  • Blood flows in one direction only (due to heart valves and vein valves)
  • The circulatory system is a closed system (blood always stays inside blood vessels)
  • Blood completes one full circuit around the body in about one minute

Important Definitions

Circulatory System: The system consisting of the heart, blood vessels, and blood that transports materials throughout the body

Heart: A muscular organ that pumps blood throughout the body

Blood Vessels: Tubes that carry blood throughout the body (arteries, veins, and capillaries)

Artery: A blood vessel with thick, elastic walls that carries blood away from the heart (usually oxygen-rich blood)

Vein: A blood vessel with thinner walls and valves that carries blood back to the heart (usually oxygen-poor blood)

Capillary: A tiny, thin-walled blood vessel where exchange of materials occurs between blood and body cells

Oxygen-rich blood: Blood that contains a high amount of oxygen (bright red in color); found in most arteries and pulmonary vein

Oxygen-poor blood: Blood that contains less oxygen and more carbon dioxide (dark red in color); found in most veins and pulmonary artery

Red blood cells: Blood cells that contain haemoglobin and transport oxygen and carbon dioxide

Haemoglobin: The red substance in red blood cells that binds with oxygen

White blood cells: Blood cells that protect the body by fighting germs and diseases

Platelets: Small cell fragments in blood that help in blood clotting

Pulse: The rhythmic expansion and contraction of arteries caused by heartbeat; can be felt at the wrist or neck

Valve: A flap-like structure that allows blood to flow in one direction only

Aorta: The largest artery that carries oxygen-rich blood from the heart to the body

Pulmonary artery: The artery that carries oxygen-poor blood from the heart to the lungs

Pulmonary vein: The vein that carries oxygen-rich blood from the lungs to the heart

Worked Examples

Example 1: Identifying Blood Vessel Types

Question: John scraped his knee while playing. The blood flowed out slowly and was dark red in color. What type of blood vessel was damaged? Explain your answer.

Step-by-step solution:

Step 1: Identify the clues in the question

  • Blood flowed out slowly
  • Blood was dark red in color

Step 2: Recall the characteristics of blood vessels

  • Arteries: Blood flows rapidly under high pressure; carries mostly oxygen-rich (bright red) blood
  • Veins: Blood flows slowly under low pressure; carries mostly oxygen-poor (dark red) blood
  • Capillaries: Very tiny vessels with very thin walls

Step 3: Match the clues to the blood vessel type

  • Slow flow → suggests vein or capillary (not artery)
  • Dark red color → suggests oxygen-poor blood → vein
  • Not mentioned as “tiny drops” or “oozing” → likely not capillary

Step 4: Write the complete answer “The blood vessel damaged was a vein. This is because the blood flowed out slowly, which shows that the blood was under low pressure. The dark red color shows that it was oxygen-poor blood. Veins carry oxygen-poor blood slowly back to the heart.”

Example 2: Tracing Blood Flow Path

Question: Trace the path of blood from the time it leaves the heart to go to the lungs until it returns to the heart. Name the blood vessels involved.

Step-by-step solution:

Step 1: Identify the starting point

  • Starting point: Heart (specifically the right side)
  • Ending point: Back to heart (left side)

Step 2: Recall the pathway to lungs

  • Heart → Lungs → Heart
  • This is pulmonary circulation

Step 3: Name the blood vessels in order

Complete answer: "The path of blood is as follows:

  1. Blood leaves the right side of the heart
  2. Blood travels through the pulmonary artery to the lungs
  3. In the lungs, blood picks up oxygen and releases carbon dioxide
  4. Blood returns through the pulmonary vein back to the left side of the heart

The blood changes from oxygen-poor blood (in pulmonary artery) to oxygen-rich blood (in pulmonary vein)."

Example 3: Functions of Blood

Question: Explain why a person who has lost a lot of blood may feel weak and dizzy, and may have difficulty breathing.

Step-by-step solution:

Step 1: Identify what blood carries

  • Oxygen (from lungs to body cells)
  • Nutrients/digested food (from small intestine to body cells)

Step 2: Connect blood loss to its functions

  • Less blood → Less oxygen delivered to cells
  • Less blood → Less nutrients delivered to cells

Step 3: Explain the symptoms

  • Cells need oxygen to release energy from food
  • Brain cells and muscle cells need lots of energy
  • Without enough oxygen, cells cannot work properly

Step 4: Write the complete answer

Complete answer: "A person who has lost a lot of blood will feel weak and dizzy because:

  1. There is less blood to carry oxygen to all the body cells, especially the brain and muscles
  2. There is less blood to carry nutrients (digested food) to the body cells
  3. Without enough oxygen and nutrients, the cells cannot release enough energy to function properly
  4. The brain needs a lot of energy to work, so when it doesn’t get enough oxygen, the person feels dizzy
  5. The muscles need energy to work, so without enough oxygen, the person feels weak
  6. The person has difficulty breathing because the body tries to breathe faster to take in more oxygen to make up for the blood loss"

Common Mistakes to Avoid

Mistake 1: Confusing which blood vessels carry oxygen-rich vs oxygen-poor blood

  • Wrong thinking: “All arteries carry oxygen-rich blood, all veins carry oxygen-poor blood”
  • Correct thinking:
    • MOST arteries carry oxygen-rich blood (exception: pulmonary artery)
    • MOST veins carry oxygen-poor blood (exception: pulmonary vein)
    • Always remember the exceptions when discussing circulation to/from the lungs

Mistake 2: Not understanding the direction of blood flow

  • Wrong thinking: “Arteries carry blood to the body, veins carry blood from the body”
  • Correct thinking:
    • Arteries carry blood AWAY from the heart (could be to lungs OR to body)
    • Veins carry blood BACK TO the heart (could be from lungs OR from body)

Mistake 3: Incomplete explanations of blood functions

  • Wrong answer: “Blood transports oxygen”
  • Better answer: “Blood transports oxygen FROM the lungs TO all body cells so that the cells can release energy”
  • Always explain: FROM where → TO where → PURPOSE (why it’s needed)

Mistake 4: Confusing the heart chambers

  • Wrong thinking: The heart only has two parts (left and right)
  • Correct thinking: The heart has FOUR chambers - left atrium, right atrium, left ventricle, right ventricle

Mistake 5: Not mentioning capillaries in material exchange

  • Wrong answer: “Oxygen passes from blood vessels to body cells”
  • Better answer: “Oxygen passes from blood in the capillaries to body cells because capillaries have very thin walls”
  • Capillaries are the ONLY place where exchange happens

Mistake 6: Saying blood “carries heat” instead of explaining temperature regulation

  • Incomplete: “Blood carries heat”
  • Better: “Blood helps regulate body temperature by distributing heat from warmer parts of the body to cooler parts”

Mistake 7: Forgetting to mention the role of haemoglobin

  • Incomplete: “Red blood cells carry oxygen”
  • Complete: “Red blood cells contain haemoglobin, which binds with oxygen to transport it to body cells”

Mistake 8: Not explaining the function of valves clearly

  • Vague: “Valves control blood flow”
  • Clear: “Valves prevent the backward flow of blood, ensuring blood flows in one direction only”

Exam Tips

Keywords to Include in Your Answers

For blood vessel questions:

  • “thick/thin walls”
  • “high/low pressure”
  • “away from heart” (arteries) or “back to heart” (veins)
  • “oxygen-rich” or “oxygen-poor”
  • “valves prevent backward flow” (for veins)

For capillary questions:

  • “very thin walls (one cell thick)”
  • “exchange of materials”
  • “between blood and body cells”

For blood function questions:

  • “FROM [source] TO [destination]”
  • “so that [purpose/reason]”
  • Example: “Blood transports oxygen FROM the lungs TO all body cells so that cells can release energy”

For circulation questions:

  • Name specific blood vessels (pulmonary artery, pulmonary vein, aorta)
  • Mention what happens to blood (picks up oxygen, releases carbon dioxide)
  • Describe the blood type change (oxygen-poor → oxygen-rich)

Mark-Earning Phrases

When explaining why arteries have thick walls: “Arteries have thick, muscular, elastic walls to withstand the high pressure of blood pumped from the heart”

When explaining capillary function: “Capillaries have very thin walls (one cell thick) to allow materials like oxygen and nutrients to pass easily between blood and body cells”

When explaining why blood appears red: “Blood appears red because of haemoglobin in red blood cells” OR “Oxygen-rich blood is bright red because haemoglobin is bound to oxygen”

When describing circulation: Always use the format: “Blood flows FROM [location] THROUGH [blood vessel] TO [destination]”

How to Score Full Marks

  1. Always explain fully - Don’t just state facts, explain WHY or HOW

    • Not just “Blood carries oxygen”
    • But “Blood carries oxygen from the lungs to all body cells so that cells can release energy”
  2. Use comparative language when comparing blood vessels:

    • “Arteries have thicker walls than veins”
    • “Blood flows faster in arteries than in veins”
  3. Include both structure and function:

    • Structure: “Capillaries have very thin walls”
    • Function: “to allow easy exchange of materials between blood and cells”
  4. Remember special cases:

    • Mention that pulmonary artery is the only artery carrying oxygen-poor blood
    • Mention that pulmonary vein is the only vein carrying oxygen-rich blood
  5. For “Explain” questions:

    • Give at least 2-3 linked points
    • Use connecting words: “because,” “so that,” “this allows,” “therefore”
  6. Draw neat, labeled diagrams when asked:

    • Use a ruler for straight lines
    • Label all parts clearly
    • Add arrows to show direction of flow
    • Use different colors if allowed (red for oxygen-rich, blue for oxygen-poor)

Quick Summary

Essential Points to Remember:

✓ The heart is a muscular pump that continuously pumps blood throughout the body

✓ The three types of blood vessels are:

  • Arteries: thick walls, carry blood away from heart, high pressure
  • Veins: thin walls, have valves, carry blood to heart, low pressure
  • Capillaries: very thin walls (one cell thick), allow exchange of materials

Four main functions of blood:

  1. Transport oxygen FROM lungs TO body cells
  2. Transport carbon dioxide FROM body cells TO lungs
  3. Transport nutrients FROM small intestine TO body cells
  4. Transport waste products FROM body cells TO kidneys

Two circulation pathways:

  • To lungs: Heart → pulmonary artery → lungs → pulmonary vein → heart
  • To body: Heart → aorta/arteries → capillaries → veins → heart

Pulmonary artery carries oxygen-poor blood (EXCEPTION to the rule about arteries)

Pulmonary vein carries oxygen-rich blood (EXCEPTION to the rule about veins)

Oxygen-rich blood is bright red; oxygen-poor blood is dark red

Material exchange (oxygen, nutrients, carbon dioxide, waste) occurs ONLY at the capillaries because their walls are very thin

Valves in veins and heart ensure blood flows in one direction only

✓ Blood contains: red blood cells (carry oxygen using haemoglobin), white blood cells (fight germs), and platelets (help blood clot)

✓ Your pulse is caused by the rhythmic pumping of blood from the heart through arteries

✓ The circulatory system is a closed system - blood always stays inside blood vessels


Study tip: Create your own diagrams and explain them out loud as if teaching someone. This helps you remember better!

✏️ 30 practice questions available

30 questions from school exam papers

Q1

The diagram below shows the flow of blood in three organs through blood vessels W, X, Y and Z. Which of the following statements are correct?
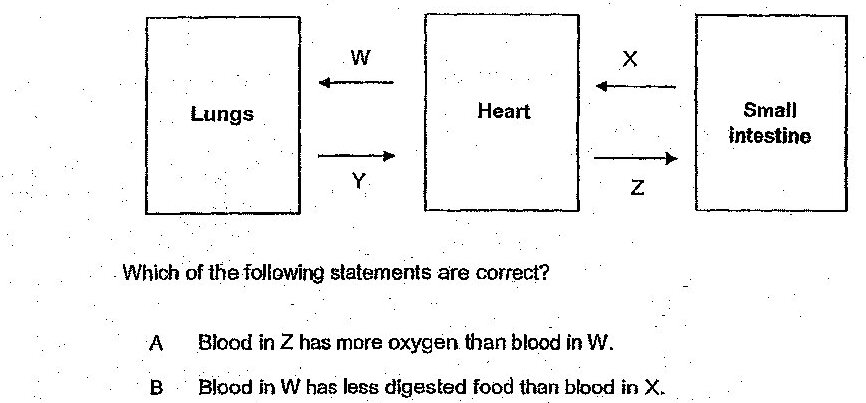
A diagram showing blood flow through three organs connected by blood vessels. The organs are: Lungs (left), Heart (center), and Small Intestine (right). Blood vessels are labeled: W connects from Lungs to Heart (with arrows showing bidirectional flow), X connects from Heart to Small Intestine, Y connects from Heart to Lungs, and Z connects from Small Intestine to Heart. The diagram shows the circulatory pathway with arrows indicating direction of blood flow.
📊 Diagram: A diagram showing blood flow through three organs connected by blood vessels. The organs are: Lungs (left), Heart (center), and Small Intestine (right). Blood vessels are labeled: W connects from Lungs to Heart (with arrows showing bidirectional flow), X connects from Heart to Small Intestine, Y connects from Heart to Lungs, and Z connects from Small Intestine to Heart. The diagram shows the circulatory pathway with arrows indicating direction of blood flow.
A. Blood in Z has more oxygen than blood in W.
B. Blood in W has less digested food than blood in X.
C. Blood in Y has less carbon dioxide than blood in W.
(1) A and B only
(2) A and C only
(3) B and C only
(4) A, B and C
P6_Science_SA2_2018_-_Henry_park 2018
Q2

The diagram below shows the direction of the blood flow in some parts of the body. The same amount of blood was taken from A, B, C and D. Which chart shows the correct comparison of the amount of oxygen in the blood samples?
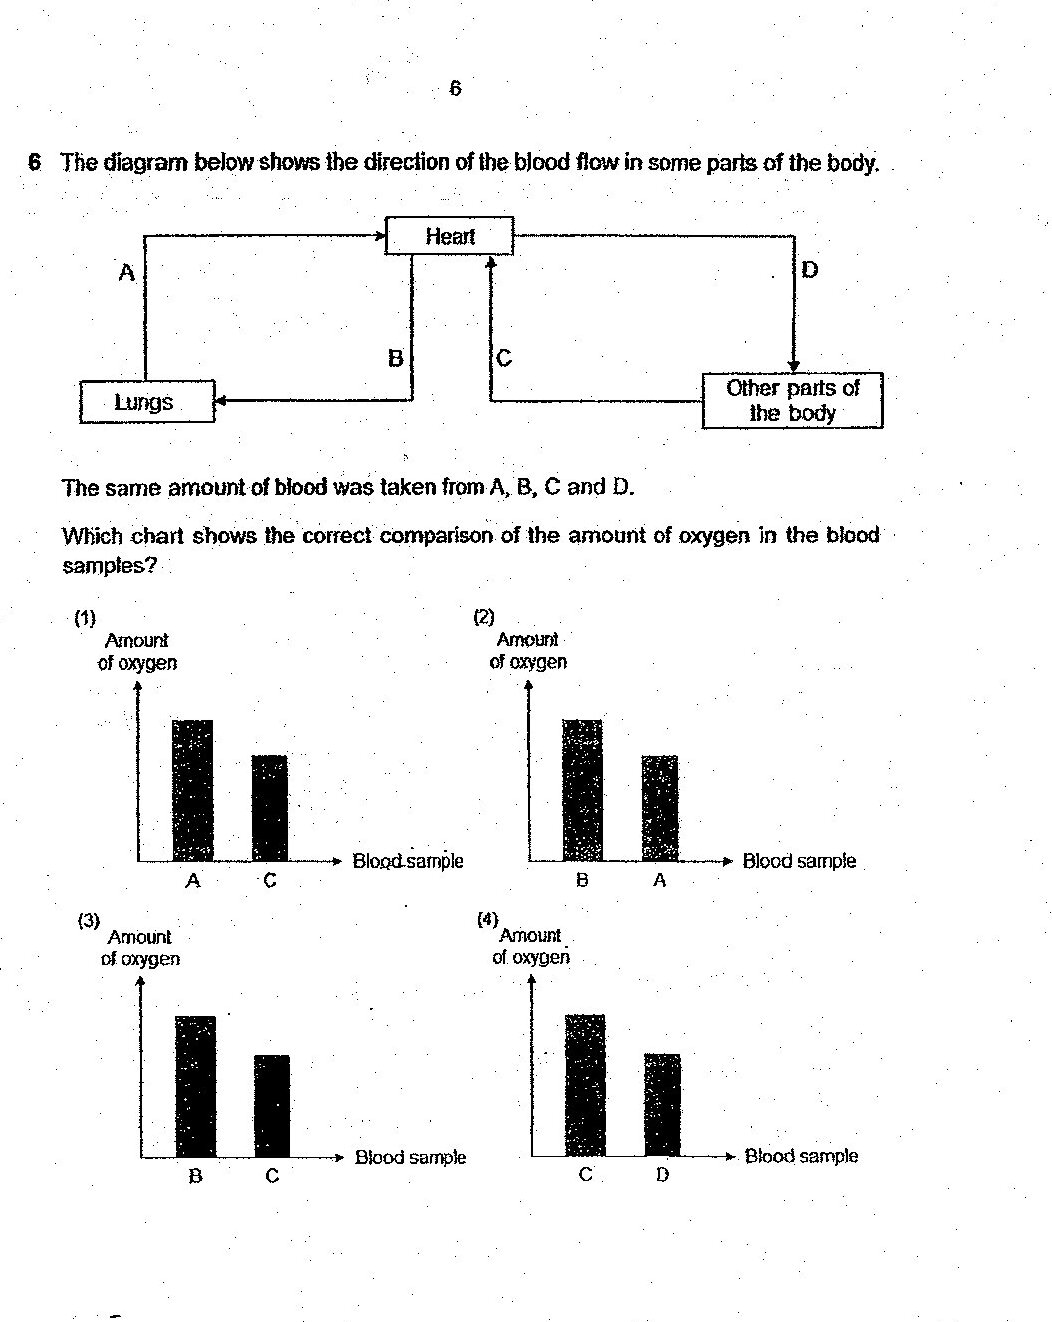
A flow diagram showing blood circulation: Blood flows from 'Other parts of the body' (labeled D) to the Heart, then splits into two paths - one path (labeled B) goes down to the Lungs and returns (labeled A) back to the Heart, and another path (labeled C) goes from the Heart back to 'Other parts of the body'. Blood samples are taken from points A, B, C, and D. Below the circulation diagram are four bar charts labeled (1) through (4), each showing oxygen amounts in blood samples. Chart (1) shows samples A and C with A having higher oxygen. Chart (2) shows samples B and A with B having higher oxygen. Chart (3) shows samples B and C with B having higher oxygen. Chart (4) shows samples C and D with C having higher oxygen.
📊 Diagram: A flow diagram showing blood circulation: Blood flows from 'Other parts of the body' (labeled D) to the Heart, then splits into two paths - one path (labeled B) goes down to the Lungs and returns (labeled A) back to the Heart, and another path (labeled C) goes from the Heart back to 'Other parts of the body'. Blood samples are taken from points A, B, C, and D. Below the circulation diagram are four bar charts labeled (1) through (4), each showing oxygen amounts in blood samples. Chart (1) shows samples A and C with A having higher oxygen. Chart (2) shows samples B and A with B having higher oxygen. Chart (3) shows samples B and C with B having higher oxygen. Chart (4) shows samples C and D with C having higher oxygen.
A.
B.
C.
D.
P6_Science_SA2_2018_-_Methodist_Girls 2018
Q3

Explain why her heart has to beat faster while running.
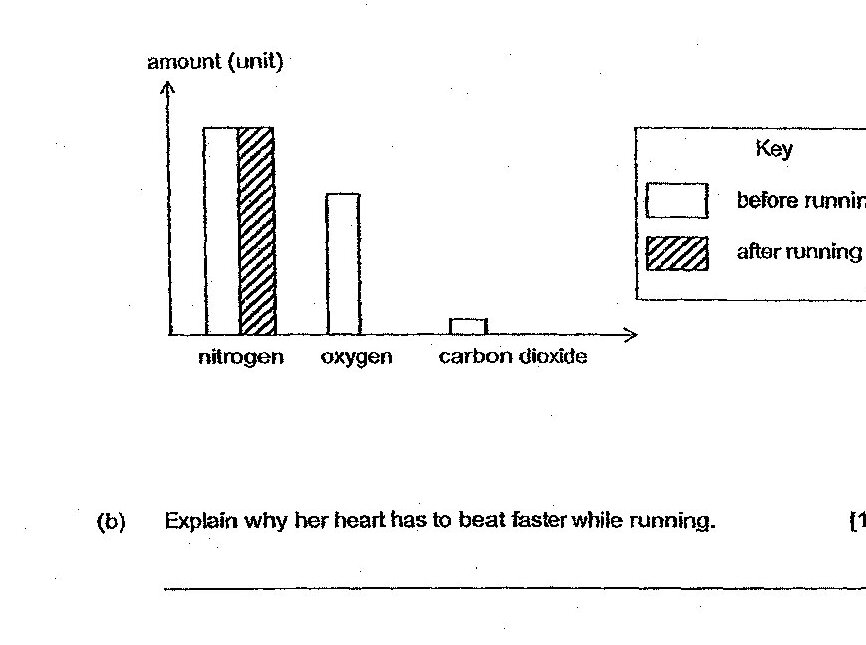
Diagram for question 33b
1 mark
P6_Science_SA2_2018_-_Nanyang 2018
Q4

Which one of the following correctly shows the movement of digested food and oxygen in the different systems of the body?
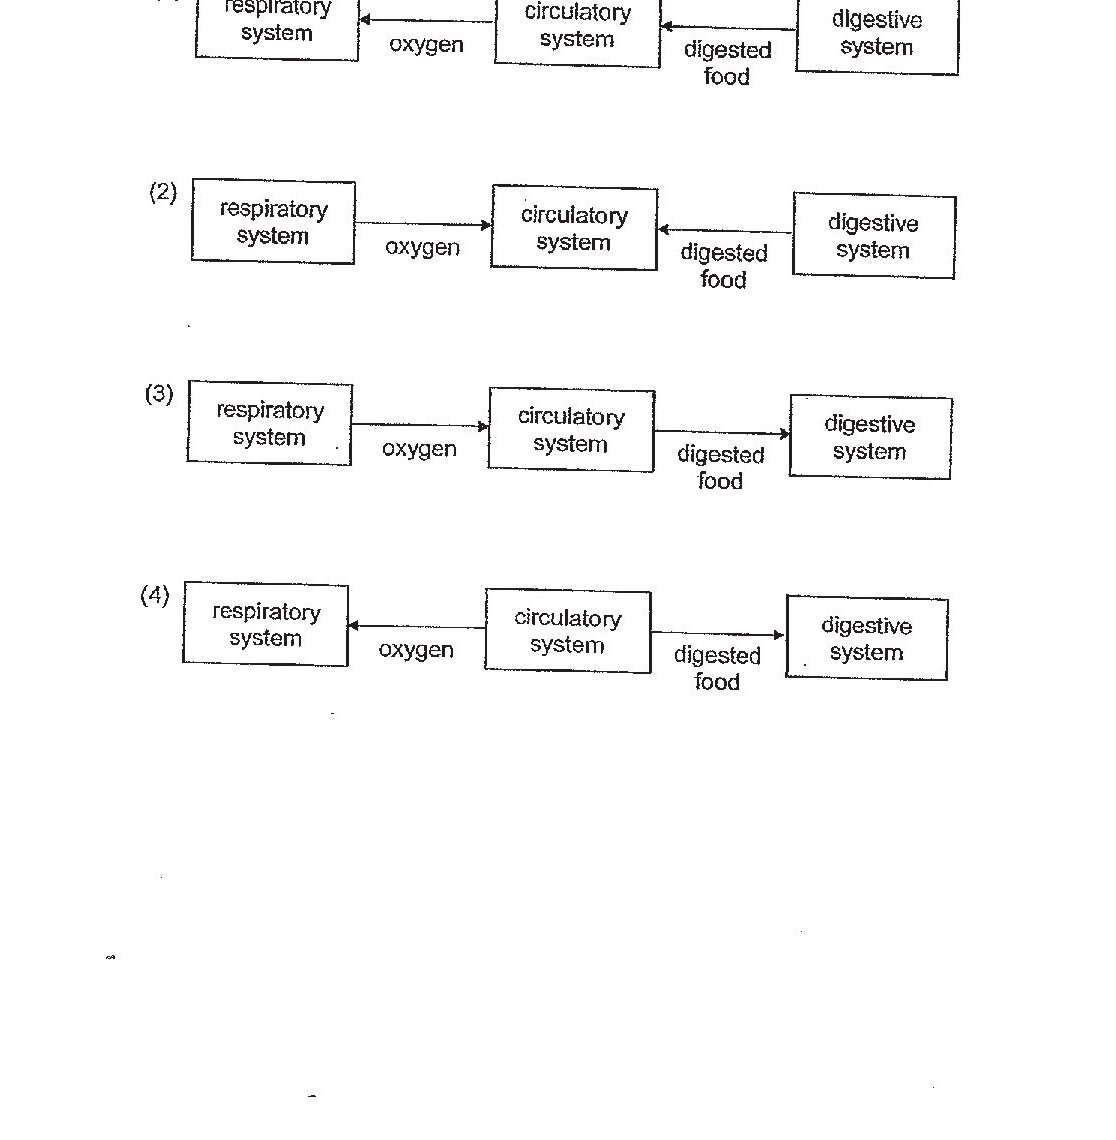
Four flow diagrams labeled (1) through (4), each showing the relationships between respiratory system, circulatory system, and digestive system with arrows indicating the direction of movement of oxygen and digested food between these systems.
📊 Diagram: Four flow diagrams labeled (1) through (4), each showing the relationships between respiratory system, circulatory system, and digestive system with arrows indicating the direction of movement of oxygen and digested food between these systems.
A. respiratory system ← oxygen ← circulatory system ← digested food ← digestive system
B. respiratory system → oxygen → circulatory system ← digested food ← digestive system
C. respiratory system → oxygen → circulatory system → digested food → digestive system
D. respiratory system ← oxygen ← circulatory system → digested food → digestive system
P6_Science_2019_Prelims_SA2_-_Catholic_High 2019
Q5

Based on the diagram, state how the flow of blood is similar between a human and a fish.
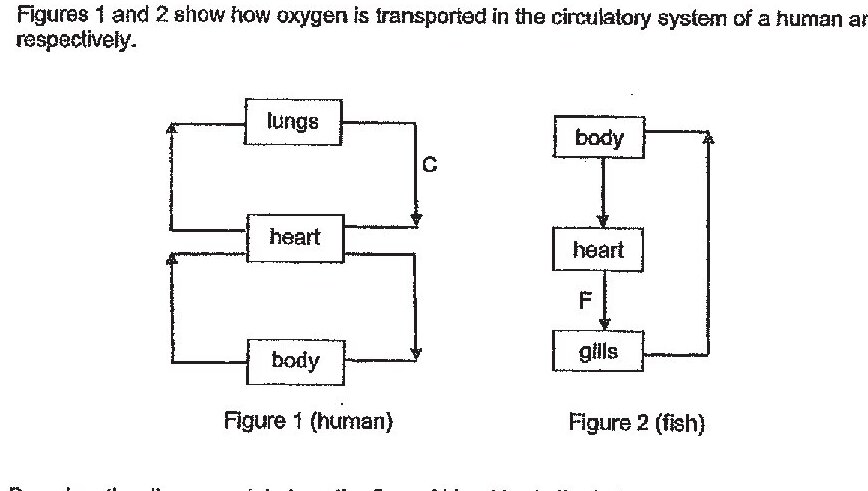
Figure 1 shows human circulatory system with lungs, heart, and body connected in a circuit. Figure 2 shows fish circulatory system with body, heart, and gills connected in a circuit. The diagrams show directional arrows indicating blood flow between organs.
📊 Diagram: Figure 1 shows human circulatory system with lungs, heart, and body connected in a circuit. Figure 2 shows fish circulatory system with body, heart, and gills connected in a circuit. The diagrams show directional arrows indicating blood flow between organs.
1 mark
P6_Science_2019_Prelims_SA2_-_Henry_Park 2019
Q6

State one difference between the amount of oxygen found in the blood flowing at C and F. Give a reason for the difference.
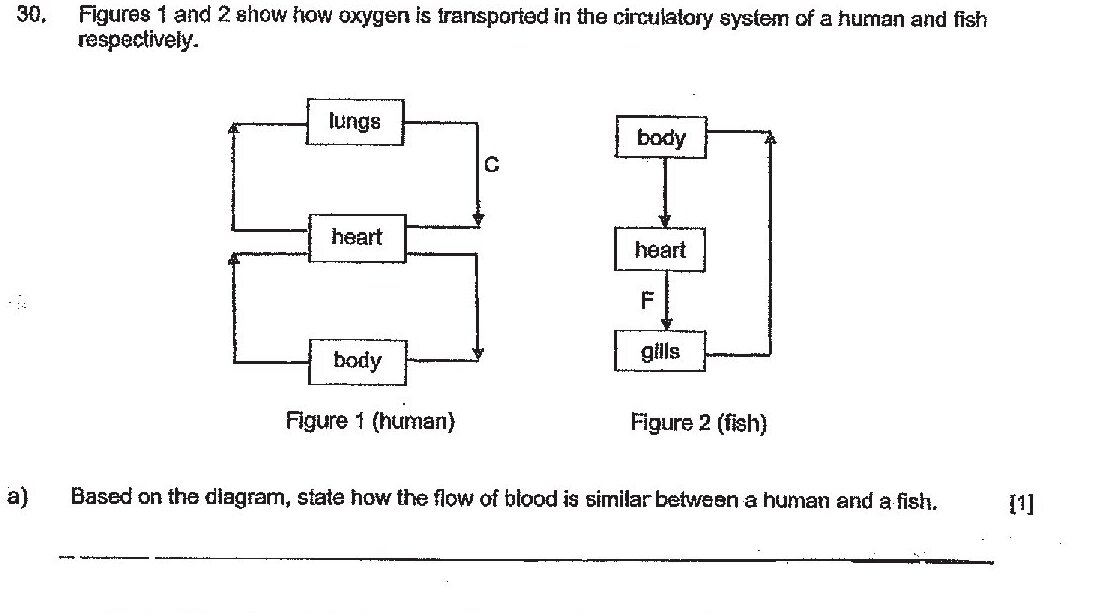
C is marked on the human diagram between lungs and heart. F is marked on the fish diagram between gills and heart.
📊 Diagram: C is marked on the human diagram between lungs and heart. F is marked on the fish diagram between gills and heart.
2 marks
P6_Science_2019_Prelims_SA2_-_Henry_Park 2019
Q7

The gills of a fish consist of many fine gill filaments. How does this structural adaptation help the fish take in more dissolved oxygen from the water?
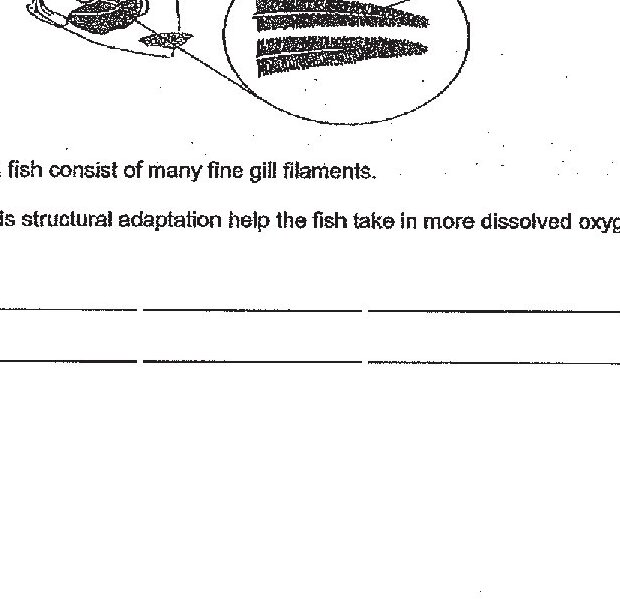
A fish head diagram showing the location of gills, with a magnified circular inset showing gill filaments arranged in fine parallel structures.
📊 Diagram: A fish head diagram showing the location of gills, with a magnified circular inset showing gill filaments arranged in fine parallel structures.
1 mark
P6_Science_2019_Prelims_SA2_-_Henry_Park 2019
Q8

The diagram below shows a part of the circulatory system of a fish. The arrows represent the movement of blood in a fish. The blood flowing through ________.
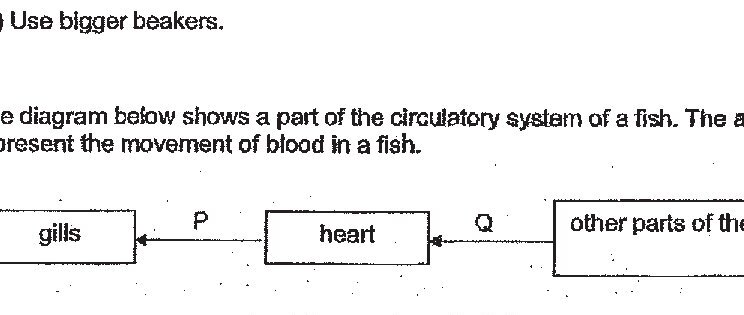
A diagram showing the circulatory system of a fish with three main components connected by arrows: gills, heart, and other parts of the body. Arrow P flows from gills to heart, arrow Q flows from heart to other parts of the body.
📊 Diagram: A diagram showing the circulatory system of a fish with three main components connected by arrows: gills, heart, and other parts of the body. Arrow P flows from gills to heart, arrow Q flows from heart to other parts of the body.
A. P and Q are rich in oxygen
B. P and Q are rich in carbon dioxide
C. P is rich in oxygen while Q is poor in oxygen
D. P is poor in oxygen while Q is rich in oxygen
P6_Science_2019_Prelims_SA2_-_Rosyth 2019
Q9

What was Bob's pulse rate when he was at rest?
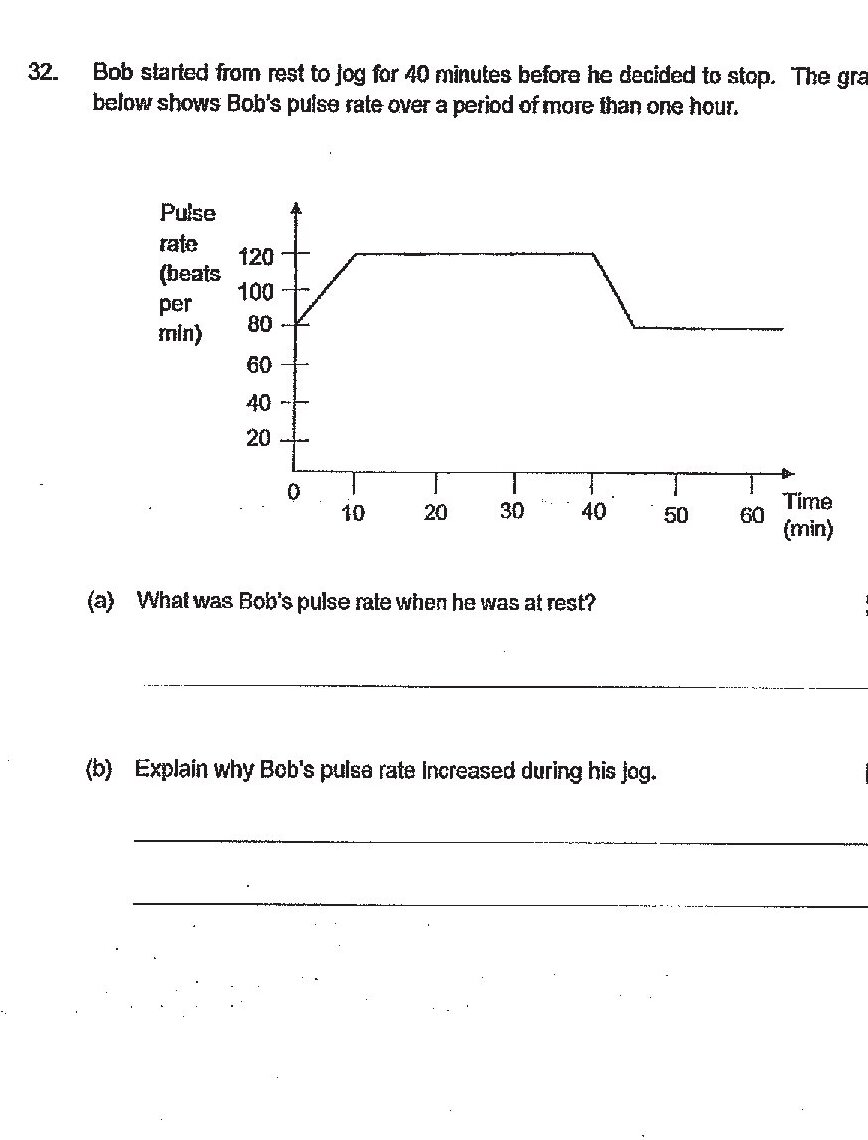
A line graph showing Bob's pulse rate (beats per min) on the y-axis ranging from 0 to 120, and time (min) on the x-axis ranging from 0 to 60. The graph shows: pulse rate at 80 beats per min at time 0 (at rest), increasing to 120 beats per min between 0-10 minutes, remaining at 120 beats per min from approximately 10-50 minutes, then decreasing to 80 beats per min from 50-60 minutes.
📊 Diagram: A line graph showing Bob's pulse rate (beats per min) on the y-axis ranging from 0 to 120, and time (min) on the x-axis ranging from 0 to 60. The graph shows: pulse rate at 80 beats per min at time 0 (at rest), increasing to 120 beats per min between 0-10 minutes, remaining at 120 beats per min from approximately 10-50 minutes, then decreasing to 80 beats per min from 50-60 minutes.
1 mark
P6_Science_2019_SA2_-_Tao_Nan 2019
Q10

Explain why Bob's pulse rate increased during his jog.
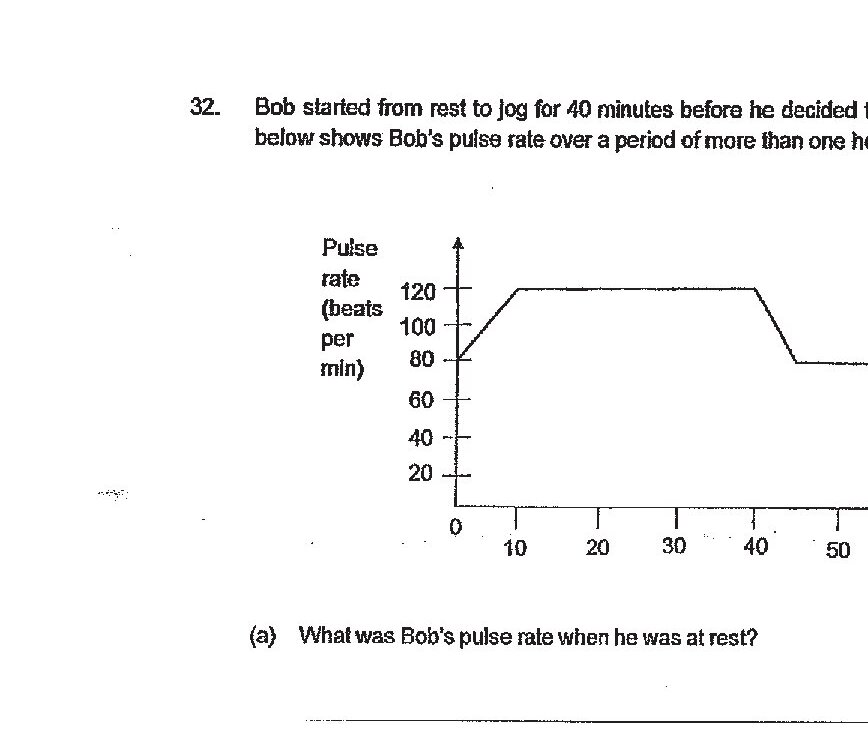
Same line graph as 32a showing Bob's pulse rate over time.
📊 Diagram: Same line graph as 32a showing Bob's pulse rate over time.
2 marks
P6_Science_2019_SA2_-_Tao_Nan 2019
Q11

The table below shows the amount of carbon dioxide found in blood samples collected from blood vessels, A, B, C and D, in the human body. Which one of the following diagrams correctly identifies blood vessels A, B, C and D?
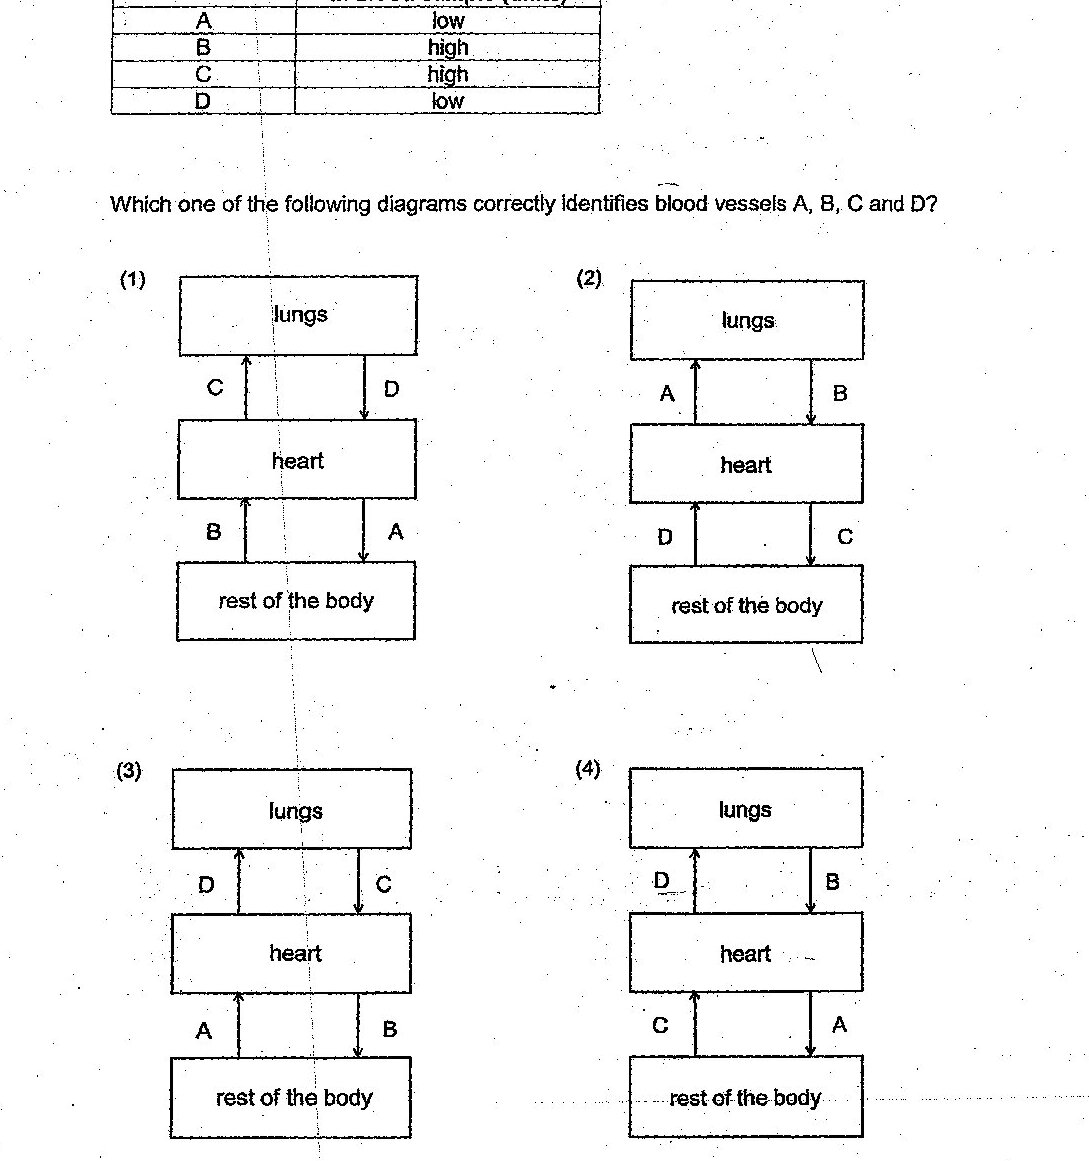
A table showing blood vessels A, B, C, D with their carbon dioxide amounts: A=low, B=high, C=high, D=low. Four diagrams (1-4) showing circulatory system flow paths between lungs, heart, and rest of body, with different labelings of vessels A, B, C, D. Diagram 1: lungs→(C,D)→heart→(B,A)→rest of body. Diagram 2: lungs→(A,B)→heart→(D,C)→rest of body. Diagram 3: lungs→(D,C)→heart→(A,B)→rest of body. Diagram 4: lungs→(D,B)→heart→(C,A)→rest of body.
📊 Diagram: A table showing blood vessels A, B, C, D with their carbon dioxide amounts: A=low, B=high, C=high, D=low. Four diagrams (1-4) showing circulatory system flow paths between lungs, heart, and rest of body, with different labelings of vessels A, B, C, D. Diagram 1: lungs→(C,D)→heart→(B,A)→rest of body. Diagram 2: lungs→(A,B)→heart→(D,C)→rest of body. Diagram 3: lungs→(D,C)→heart→(A,B)→rest of body. Diagram 4: lungs→(D,B)→heart→(C,A)→rest of body.
A.
B.
C.
D.
P6_Science_SA2_2019_-_Nanyang 2019
Q12

What was Bob's pulse rate when he was at rest?
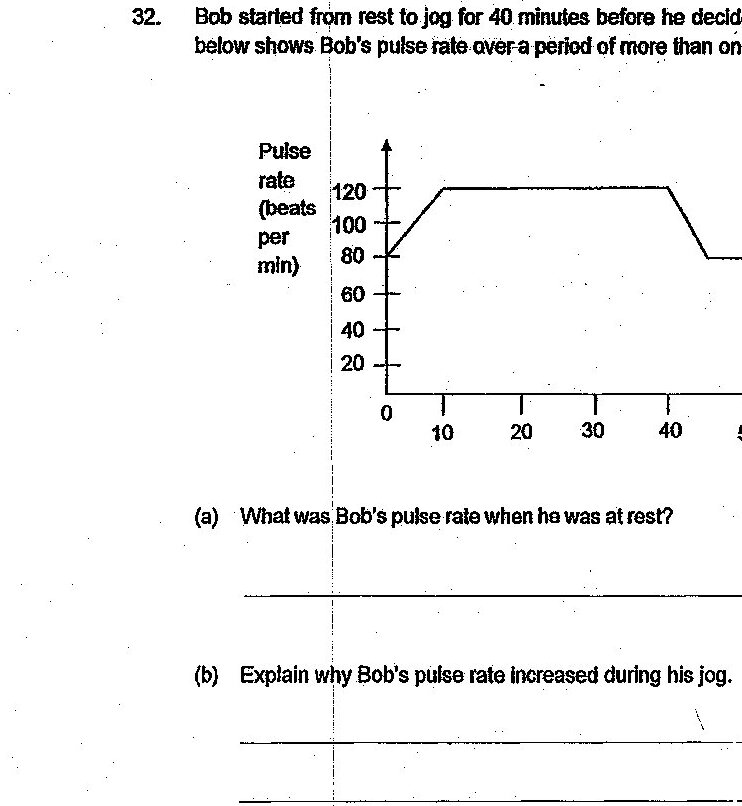
A line graph showing pulse rate (beats per minute) on the y-axis (ranging from 0 to 120) and time in minutes on the x-axis (ranging from 0 to 60). The graph shows: a flat line at 80 beats per minute from 0 to approximately 5 minutes, then increases to 120 beats per minute between 5 and 10 minutes, remains flat at 120 beats per minute from 10 to 40 minutes, then decreases to 80 beats per minute between 40 and 50 minutes, and remains flat at 80 beats per minute from 50 to 60 minutes.
📊 Diagram: A line graph showing pulse rate (beats per minute) on the y-axis (ranging from 0 to 120) and time in minutes on the x-axis (ranging from 0 to 60). The graph shows: a flat line at 80 beats per minute from 0 to approximately 5 minutes, then increases to 120 beats per minute between 5 and 10 minutes, remains flat at 120 beats per minute from 10 to 40 minutes, then decreases to 80 beats per minute between 40 and 50 minutes, and remains flat at 80 beats per minute from 50 to 60 minutes.
1 mark
P6_Science_SA2_2019_-_Tao_Nan 2019
Q13

Explain why Bob's pulse rate increased during his jog.
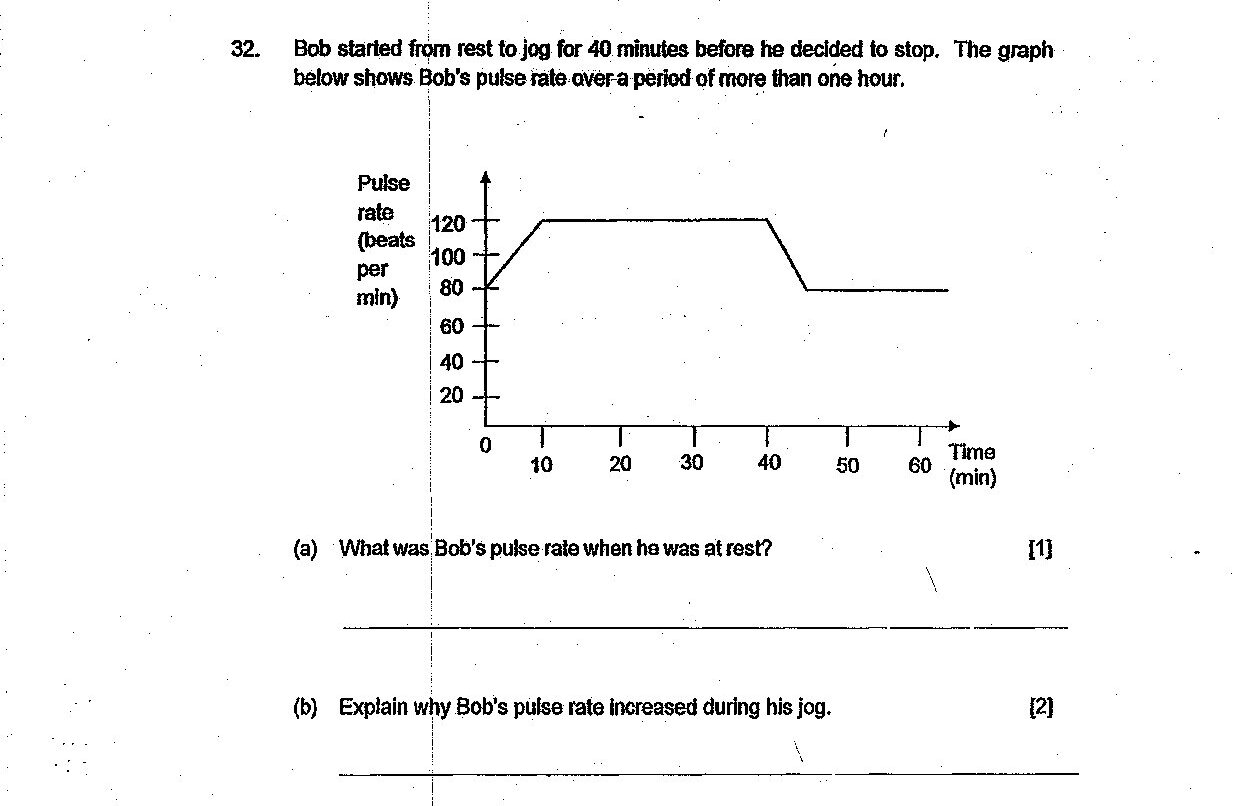
Same graph as 32a
📊 Diagram: Same graph as 32a
2 marks
P6_Science_SA2_2019_-_Tao_Nan 2019
Q14

The diagram below shows a simple representation of blood circulation in a human body. Arrows W, X, Y and Z represent the flow of blood to different parts of the body. Which one of the following graphs correctly represents the amount of carbon dioxide in W, X, Y and Z?
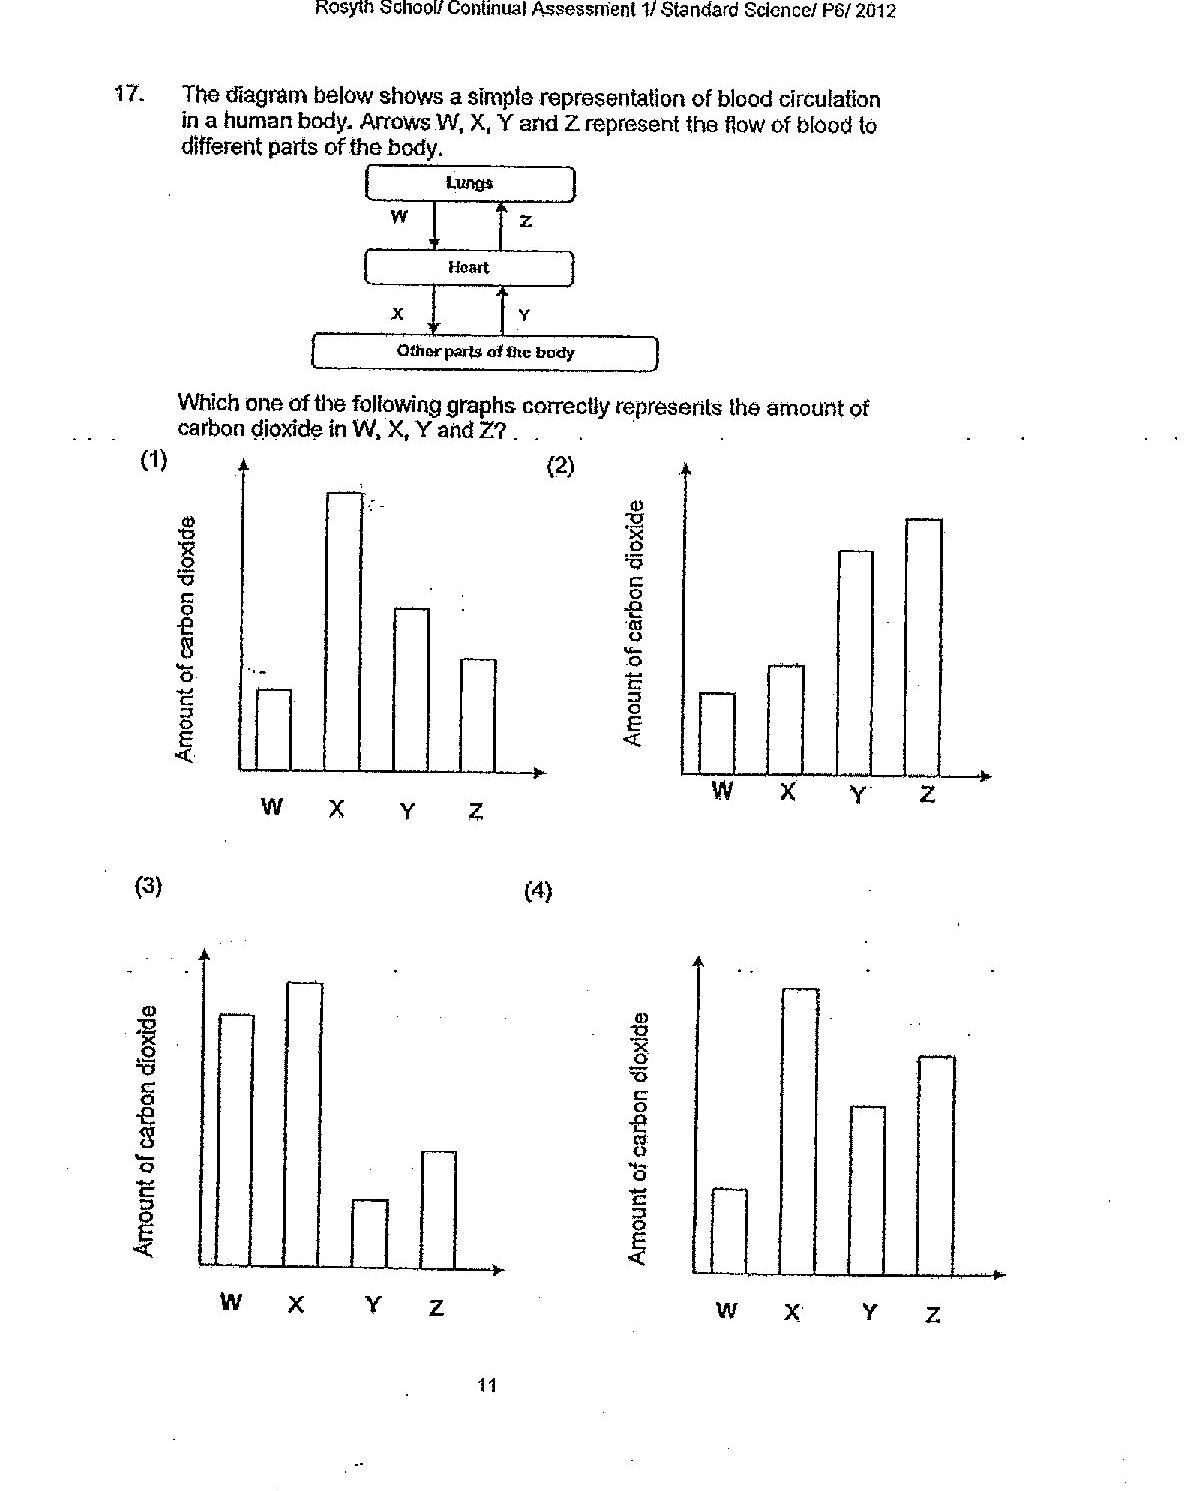
A flow diagram showing blood circulation: Lungs (with arrows W and Z) connected to Heart (with arrows X and Y) connected to Other parts of the body. Below this are four bar graphs labeled (1) through (4), each showing the amount of carbon dioxide on the y-axis and W, X, Y, Z on the x-axis with different bar height patterns.
📊 Diagram: A flow diagram showing blood circulation: Lungs (with arrows W and Z) connected to Heart (with arrows X and Y) connected to Other parts of the body. Below this are four bar graphs labeled (1) through (4), each showing the amount of carbon dioxide on the y-axis and W, X, Y, Z on the x-axis with different bar height patterns.
A.
B.
C.
D.
P6_Science_2020_Prelims_-_Tao_Nan 2020
Q15

The diagram below shows how blood flows in certain parts of the human body. Which two arrows show the incorrect blood flow between the organs?
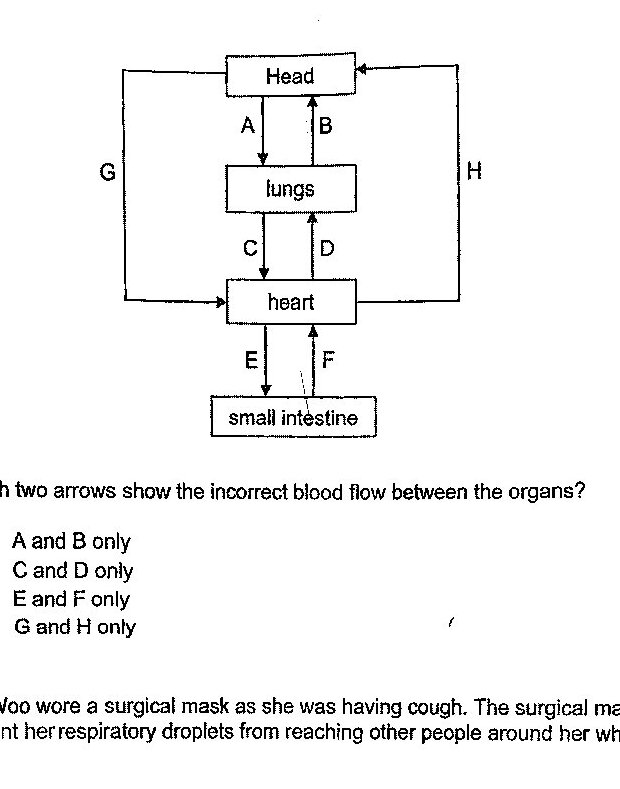
A flow diagram with four labelled boxes arranged vertically: 'Head' at the top, 'lungs' below it, 'heart' below the lungs, and 'small intestine' at the bottom. Between Head and lungs are two vertical arrows: A points downward from Head to lungs, and B points upward from lungs to Head. Between lungs and heart are two vertical arrows: C points downward from lungs to heart, and D points upward from heart to lungs. Between heart and small intestine are two vertical arrows: E points downward from heart to small intestine, and F points upward from small intestine to heart. There are also two outer loop pathways: G is a left-side path running from Head down and across into the heart with the arrow pointing into the heart; H is a right-side path running from the heart up and across into the Head with the arrow pointing into the Head.
📊 Diagram: A flow diagram with four labelled boxes arranged vertically: 'Head' at the top, 'lungs' below it, 'heart' below the lungs, and 'small intestine' at the bottom. Between Head and lungs are two vertical arrows: A points downward from Head to lungs, and B points upward from lungs to Head. Between lungs and heart are two vertical arrows: C points downward from lungs to heart, and D points upward from heart to lungs. Between heart and small intestine are two vertical arrows: E points downward from heart to small intestine, and F points upward from small intestine to heart. There are also two outer loop pathways: G is a left-side path running from Head down and across into the heart with the arrow pointing into the heart; H is a right-side path running from the heart up and across into the Head with the arrow pointing into the Head.
A. A and B only
B. C and D only
C. E and F only
D. G and H only
2022-P6-Science-Prelim-MGS 2022
Q16

The diagram below shows how two different systems work together in the human body. Which of the following correctly identifies systems Y and Z and substances A and B correctly?
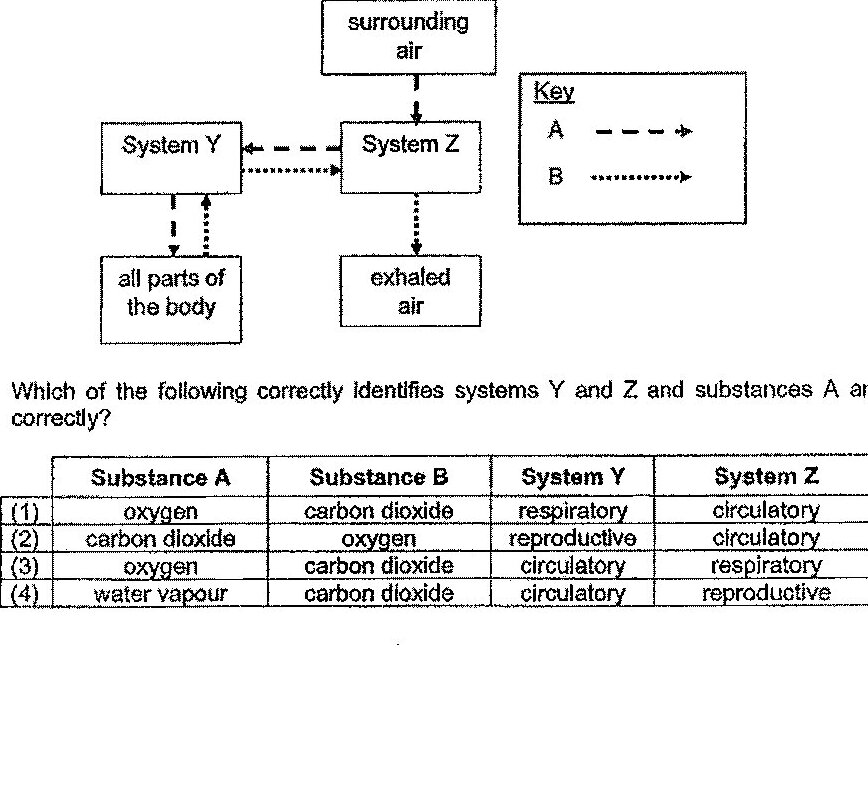
A flow diagram with four labeled boxes: 'surrounding air' at the top center, 'System Z' below it, 'System Y' to the left of System Z, 'all parts of the body' below System Y, and 'exhaled air' below System Z. There is a solid downward arrow from 'surrounding air' to 'System Z'. A dashed arrow labeled by key as substance A points from 'System Z' to 'System Y' (leftward). A dotted arrow labeled by key as substance B points from 'System Y' to 'System Z' (rightward). Between 'System Y' and 'all parts of the body', a dashed arrow points downward from System Y to all parts of the body, and a dotted arrow points upward from all parts of the body to System Y. From 'System Z' to 'exhaled air', a dotted arrow points downward. The key shows A represented by a dashed arrow and B represented by a dotted arrow.
📊 Diagram: A flow diagram with four labeled boxes: 'surrounding air' at the top center, 'System Z' below it, 'System Y' to the left of System Z, 'all parts of the body' below System Y, and 'exhaled air' below System Z. There is a solid downward arrow from 'surrounding air' to 'System Z'. A dashed arrow labeled by key as substance A points from 'System Z' to 'System Y' (leftward). A dotted arrow labeled by key as substance B points from 'System Y' to 'System Z' (rightward). Between 'System Y' and 'all parts of the body', a dashed arrow points downward from System Y to all parts of the body, and a dotted arrow points upward from all parts of the body to System Y. From 'System Z' to 'exhaled air', a dotted arrow points downward. The key shows A represented by a dashed arrow and B represented by a dotted arrow.
A. Substance A: oxygen; Substance B: carbon dioxide; System Y: respiratory; System Z: circulatory
B. Substance A: carbon dioxide; Substance B: oxygen; System Y: reproductive; System Z: circulatory
C. Substance A: oxygen; Substance B: carbon dioxide; System Y: circulatory; System Z: respiratory
D. Substance A: water vapour; Substance B: carbon dioxide; System Y: circulatory; System Z: reproductive
2022-P6-Science-Prelim-Nan_Hua 2022
Q17

Which of the following diagrams shows how blood flows in the human body correctly?
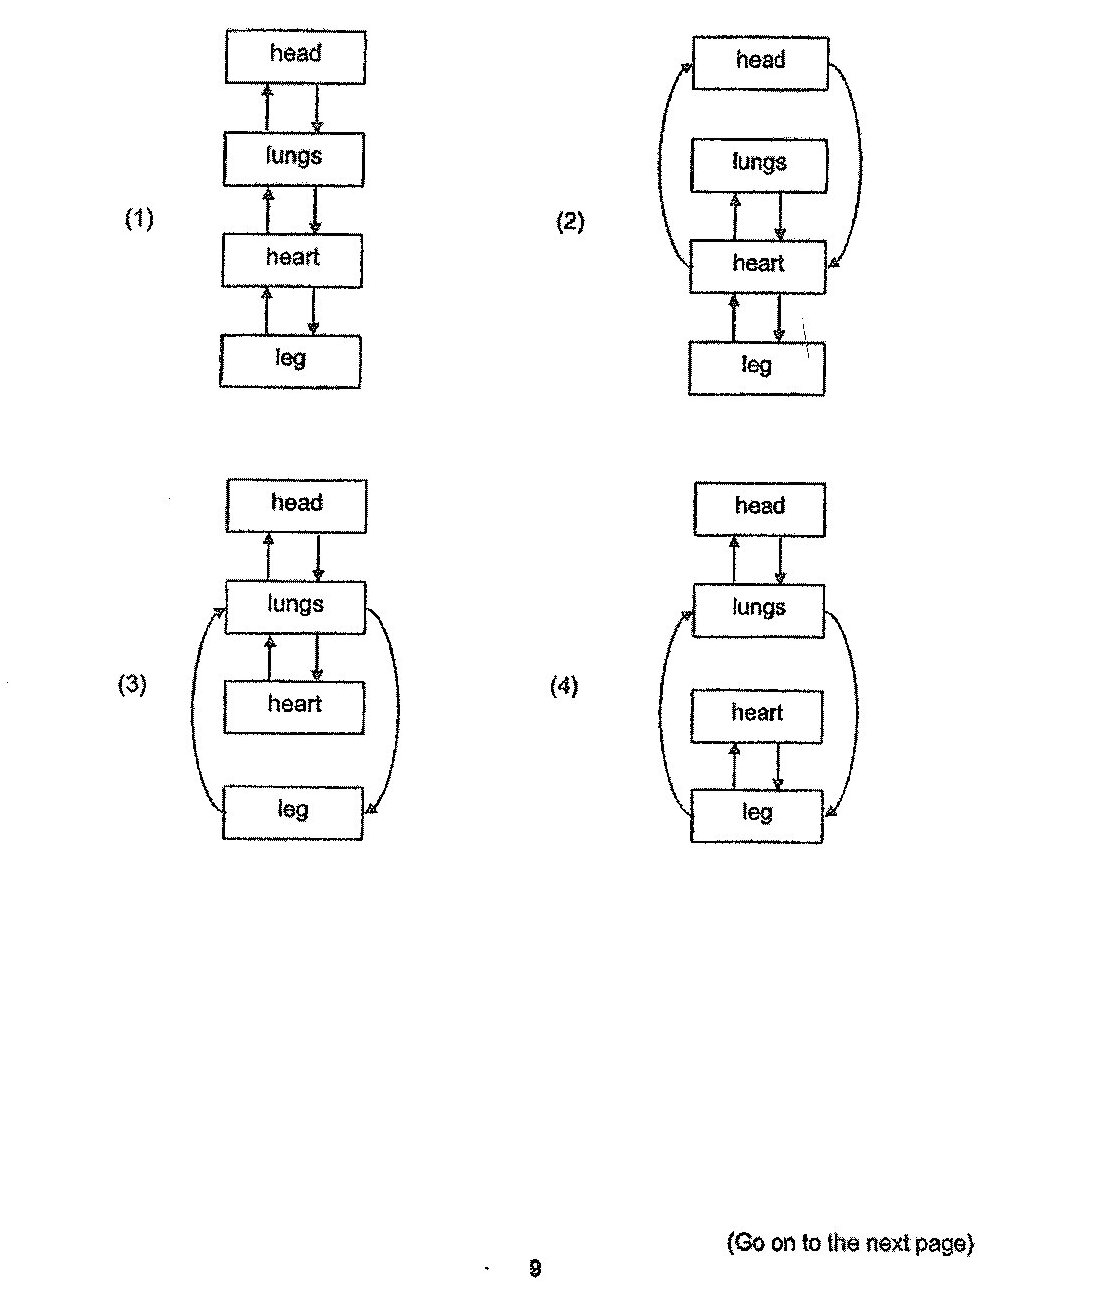
Four labelled flow diagrams are shown, each using boxes labelled head, lungs, heart, and leg with arrows between them. Diagram (1): boxes arranged vertically from top to bottom as head, lungs, heart, leg, with two-way vertical arrows between each adjacent pair. Diagram (2): head at top, lungs below it, heart below lungs, leg at bottom; two-way arrows between lungs and heart, and between heart and leg; additionally, large curved arrows connect heart and head directly in both directions around the sides. Diagram (3): head at top, lungs below, heart below lungs, leg at bottom; two-way arrows between head and lungs, and between lungs and heart; additionally, large curved arrows connect lungs and leg directly in both directions around the sides. Diagram (4): head at top, lungs below, heart below lungs, leg at bottom; two-way arrows between head and lungs, and between heart and leg; additionally, large curved arrows connect lungs and leg directly in both directions around the sides.
📊 Diagram: Four labelled flow diagrams are shown, each using boxes labelled head, lungs, heart, and leg with arrows between them. Diagram (1): boxes arranged vertically from top to bottom as head, lungs, heart, leg, with two-way vertical arrows between each adjacent pair. Diagram (2): head at top, lungs below it, heart below lungs, leg at bottom; two-way arrows between lungs and heart, and between heart and leg; additionally, large curved arrows connect heart and head directly in both directions around the sides. Diagram (3): head at top, lungs below, heart below lungs, leg at bottom; two-way arrows between head and lungs, and between lungs and heart; additionally, large curved arrows connect lungs and leg directly in both directions around the sides. Diagram (4): head at top, lungs below, heart below lungs, leg at bottom; two-way arrows between head and lungs, and between heart and leg; additionally, large curved arrows connect lungs and leg directly in both directions around the sides.
A. Diagram (1)
B. Diagram (2)
C. Diagram (3)
D. Diagram (4)
2022-P6-Science-Prelim-Nan_Hua 2022
Q18

Sarah drew the diagram below to show the blood flow in some parts of the human body. Which two arrows were not drawn correctly?
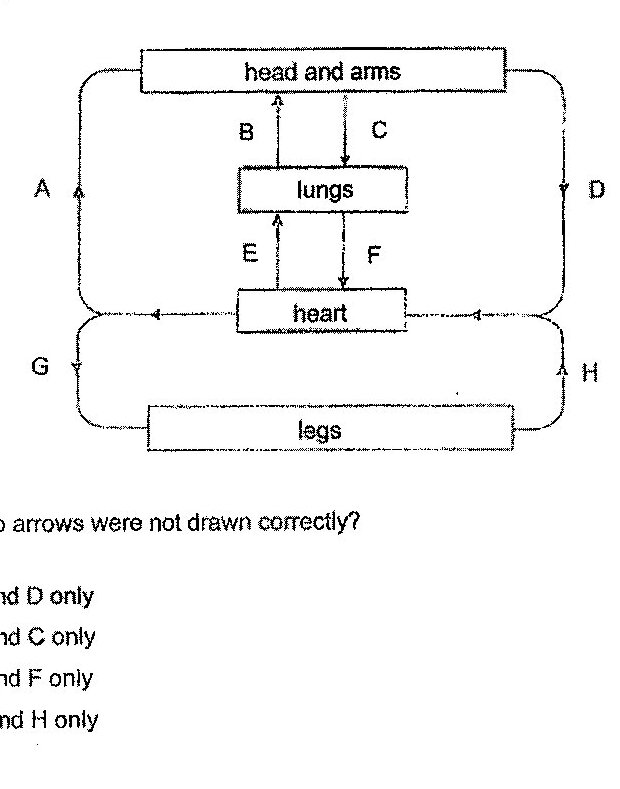
A flow diagram with four labeled body parts: a top box labeled 'head and arms', a middle box labeled 'lungs', a lower middle box labeled 'heart', and a bottom box labeled 'legs'. Arrows labeled A to H show blood flow directions along connecting pathways. A is on the left outer pathway between the heart region and head/arms, pointing upward. D is on the right outer pathway between head/arms and heart region, pointing downward. G is on the left lower outer pathway between the heart region and legs, pointing downward. H is on the right lower outer pathway between legs and the heart region, pointing upward. Between head/arms and lungs are two vertical arrows: B on the left points upward from lungs toward head/arms, and C on the right points downward from head/arms toward lungs. Between lungs and heart are two vertical arrows: E on the left points upward from heart toward lungs, and F on the right points downward from lungs toward heart. There are also horizontal arrows near the heart showing flow from both left and right sides toward the heart.
📊 Diagram: A flow diagram with four labeled body parts: a top box labeled 'head and arms', a middle box labeled 'lungs', a lower middle box labeled 'heart', and a bottom box labeled 'legs'. Arrows labeled A to H show blood flow directions along connecting pathways. A is on the left outer pathway between the heart region and head/arms, pointing upward. D is on the right outer pathway between head/arms and heart region, pointing downward. G is on the left lower outer pathway between the heart region and legs, pointing downward. H is on the right lower outer pathway between legs and the heart region, pointing upward. Between head/arms and lungs are two vertical arrows: B on the left points upward from lungs toward head/arms, and C on the right points downward from head/arms toward lungs. Between lungs and heart are two vertical arrows: E on the left points upward from heart toward lungs, and F on the right points downward from lungs toward heart. There are also horizontal arrows near the heart showing flow from both left and right sides toward the heart.
A. A and D only
B. B and C only
C. E and F only
D. G and H only
2022-P6-Science-Prelim-PLMGS 2022
Q19

Describe how oxygen in the environment reaches Devan's arms and legs.
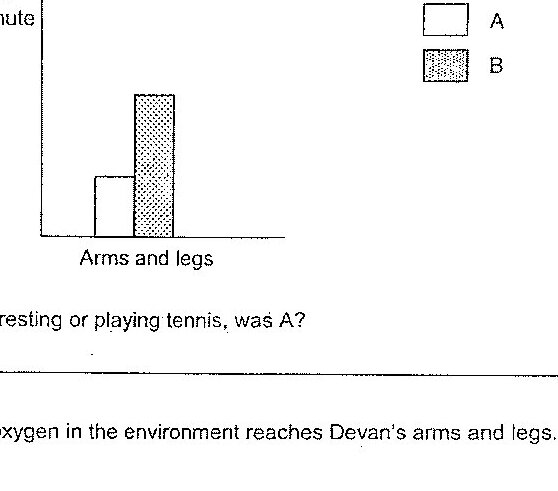
Diagram for question 30b
2 marks
P6_Science_Prelim_2022_ACSJ_Exam_Papers 2022
Q20

A spring of original length, 20 cm, was hung and came to rest as shown in the diagram. Which statement(s) is/are correct about the spring that was hung?
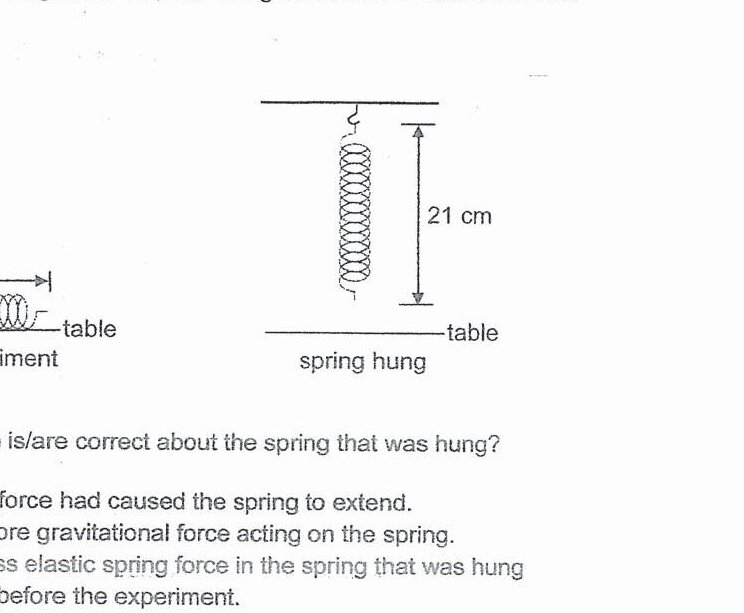
Diagram for question 28
A Gravitational force had caused the spring to extend.
B There was more gravitational force acting on the spring.
C There was less elastic spring force in the spring that was hung than the one before the experiment.
P6_Science_Prelim_2022_CatholicHigh_Exam_Papers 2022
Q21

The heart rate for the first 10 minutes has been drawn. Complete the graph to show how Muthu's heart rate changes during his exercise routine of 40 minutes.
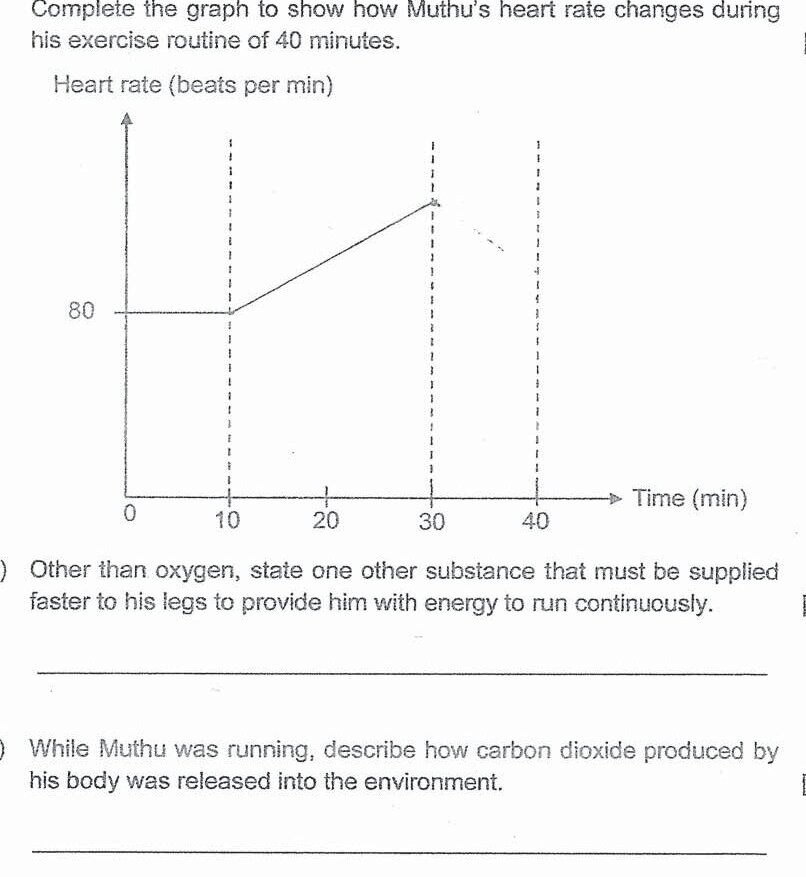
A line graph with x-axis labeled 'Time (min)' ranging from 0 to 40, and y-axis labeled 'Heart rate (beats per min)' with a marked value of 80. The graph shows a horizontal line at 80 beats per minute from 0 to 10 minutes. Vertical dashed lines are drawn at 10, 30, and 40 minutes. The student is required to complete the graph for the period from 10 to 40 minutes, which should show: an increase from 10 to 30 minutes (running phase), then a decrease from 30 to 40 minutes (final walking phase).
📊 Diagram: A line graph with x-axis labeled 'Time (min)' ranging from 0 to 40, and y-axis labeled 'Heart rate (beats per min)' with a marked value of 80. The graph shows a horizontal line at 80 beats per minute from 0 to 10 minutes. Vertical dashed lines are drawn at 10, 30, and 40 minutes. The student is required to complete the graph for the period from 10 to 40 minutes, which should show: an increase from 10 to 30 minutes (running phase), then a decrease from 30 to 40 minutes (final walking phase).
1 mark
P6_Science_Prelim_2022_CatholicHigh_Exam_Papers 2022
Q22

Study the diagram below. A, B, C and D are blood vessels. Which one of the statements below is correct?
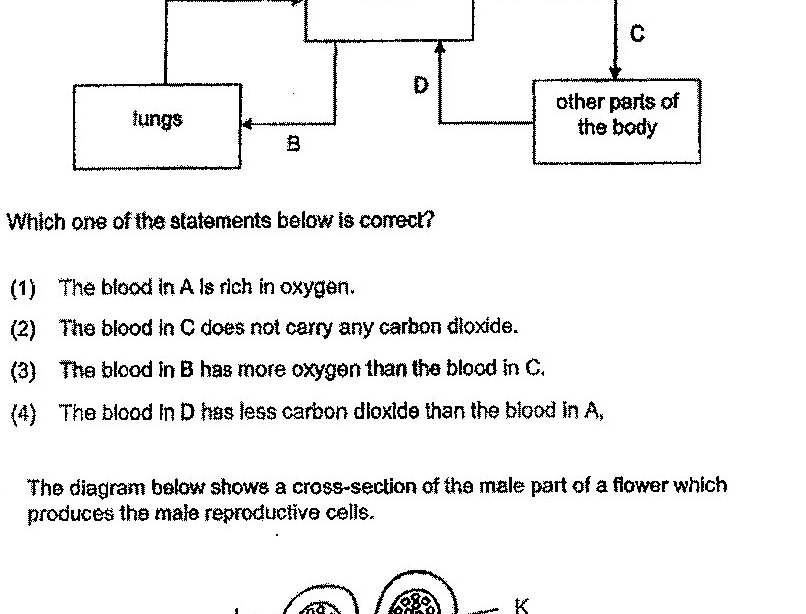
A circulatory system diagram showing the heart connected to lungs and other parts of the body. Vessel A carries blood from lungs to heart. Vessel B carries blood from heart to lungs. Vessel C carries blood from heart to other parts of the body. Vessel D is internal to the heart.
📊 Diagram: A circulatory system diagram showing the heart connected to lungs and other parts of the body. Vessel A carries blood from lungs to heart. Vessel B carries blood from heart to lungs. Vessel C carries blood from heart to other parts of the body. Vessel D is internal to the heart.
A. The blood in A is rich in oxygen.
B. The blood in C does not carry any carbon dioxide.
C. The blood in B has more oxygen than the blood in C.
D. The blood in D has less carbon dioxide than the blood in A.
P6_Science_Prelim_2022_HenryPark_Exam_Papers 2022
Q23

The diagram below shows how two different systems work together in the human body. Which of the following correctly identifies systems Y and Z and substances A and B correctly?
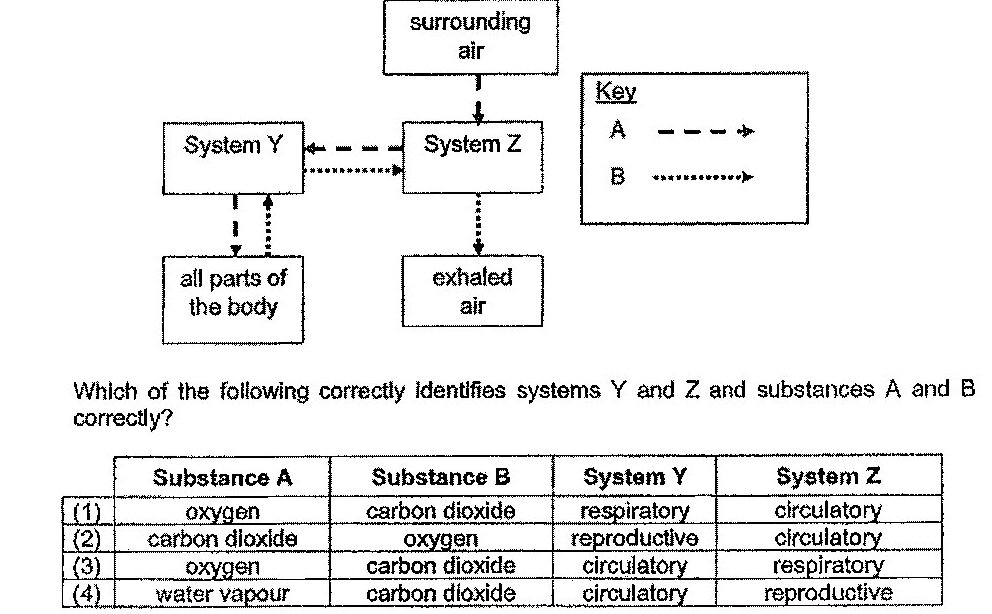
A flow diagram showing the interaction between two systems. 'Surrounding air' at the top flows into 'System Z'. System Y and System Z are connected with a dashed arrow (A) from System Y to System Z and a dotted arrow (B) from System Z to System Y. From System Y, dashed and dotted arrows flow down to 'all parts of the body'. From System Z, dashed and dotted arrows flow down to 'exhaled air'. A key shows: A (dashed arrow) and B (dotted arrow).
📊 Diagram: A flow diagram showing the interaction between two systems. 'Surrounding air' at the top flows into 'System Z'. System Y and System Z are connected with a dashed arrow (A) from System Y to System Z and a dotted arrow (B) from System Z to System Y. From System Y, dashed and dotted arrows flow down to 'all parts of the body'. From System Z, dashed and dotted arrows flow down to 'exhaled air'. A key shows: A (dashed arrow) and B (dotted arrow).
A. Substance A: oxygen, Substance B: carbon dioxide, System Y: respiratory, System Z: circulatory
B. Substance A: carbon dioxide, Substance B: oxygen, System Y: reproductive, System Z: circulatory
C. Substance A: oxygen, Substance B: carbon dioxide, System Y: circulatory, System Z: respiratory
D. Substance A: water vapour, Substance B: carbon dioxide, System Y: circulatory, System Z: reproductive
P6_Science_Prelim_2022_NanHua_Exam_Papers 2022
Q24

Which of the following diagrams shows how blood flows in the human body correctly?
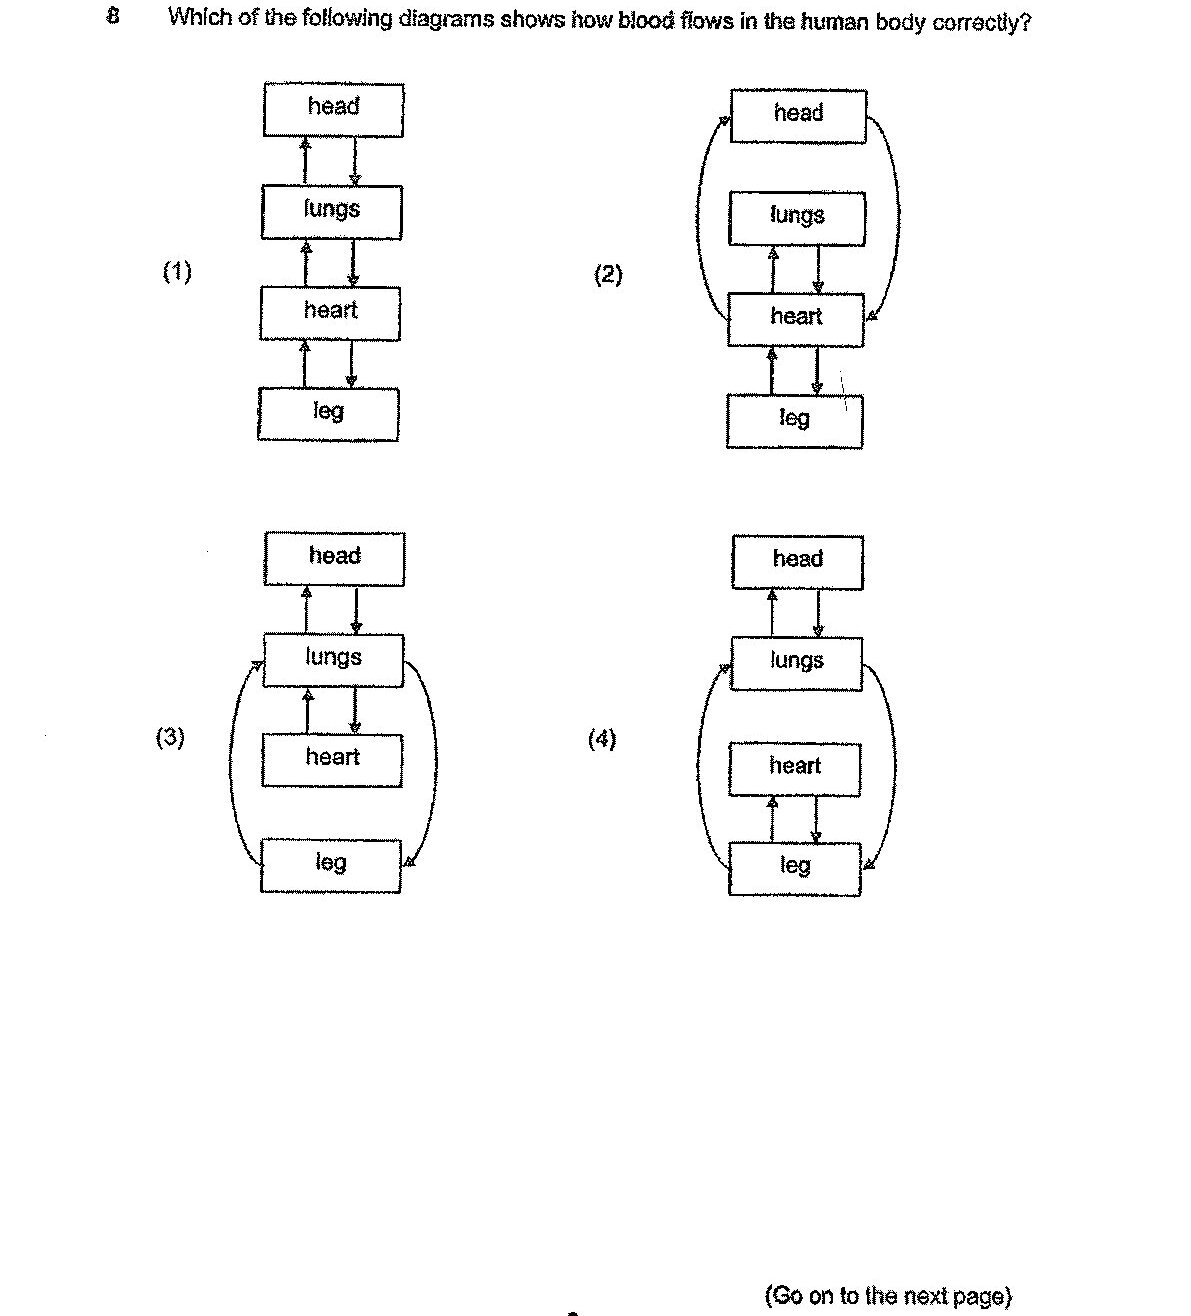
Four flow diagrams labeled (1), (2), (3), and (4) showing blood flow through different organs:
(1) Linear flow: head → lungs → heart → leg with bidirectional arrows between head and lungs
(2) Circular flow with head at top, lungs and heart in middle (with lungs and heart connected by bidirectional arrows), and leg at bottom, with curved arrows connecting heart to head and heart to leg
(3) Circular flow with head at top, lungs and heart in middle (with lungs and heart connected by bidirectional arrows), and leg at bottom, with curved arrows creating a circuit between all organs
(4) Circular flow with head at top, lungs and heart in middle (with lungs and heart connected by bidirectional arrows), and leg at bottom, with curved arrows connecting head to lungs to heart to leg forming a circuit
📊 Diagram: Four flow diagrams labeled (1), (2), (3), and (4) showing blood flow through different organs: (1) Linear flow: head → lungs → heart → leg with bidirectional arrows between head and lungs (2) Circular flow with head at top, lungs and heart in middle (with lungs and heart connected by bidirectional arrows), and leg at bottom, with curved arrows connecting heart to head and heart to leg (3) Circular flow with head at top, lungs and heart in middle (with lungs and heart connected by bidirectional arrows), and leg at bottom, with curved arrows creating a circuit between all organs (4) Circular flow with head at top, lungs and heart in middle (with lungs and heart connected by bidirectional arrows), and leg at bottom, with curved arrows connecting head to lungs to heart to leg forming a circuit
A. Diagram (1)
B. Diagram (2)
C. Diagram (3)
D. Diagram (4)
P6_Science_Prelim_2022_NanHua_Exam_Papers 2022
Q25

Complete the graph to show how Jenny's heart rate changed from fifteenth to twentieth minute.
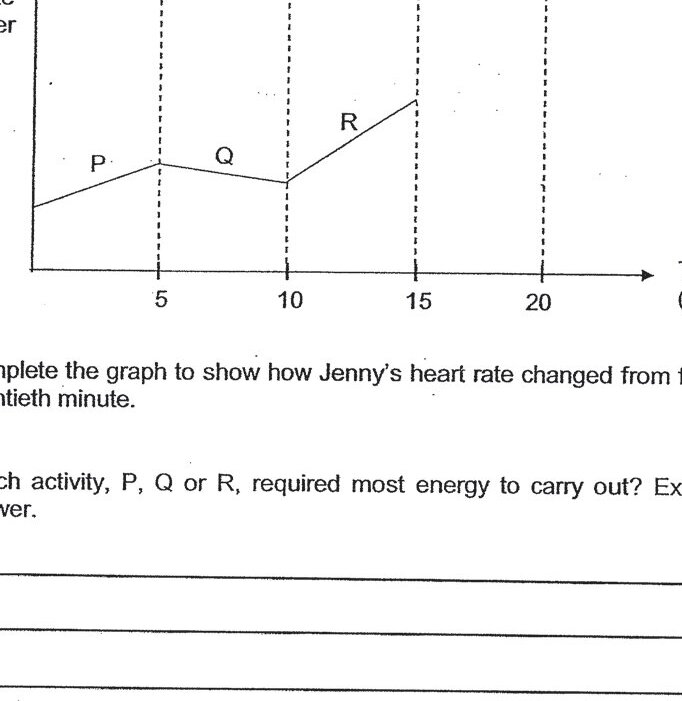
A line graph showing heart rate (beats per min) on the y-axis and time (min) on the x-axis. The graph shows Jenny's heart rate from 0 to 20 minutes. From 0-5 minutes, she was resting on a chair (labeled P). From 5-10 minutes, she carried out activity Q. From 10-15 minutes, she carried out activity R. The graph shows a line for P (roughly horizontal at around 70 bpm), followed by Q (slight decrease), then R (increase to around 100 bpm at the 15-minute mark). The section from 15-20 minutes needs to be completed. Vertical dashed lines mark the boundaries at 5, 10, 15, and 20 minutes.
📊 Diagram: A line graph showing heart rate (beats per min) on the y-axis and time (min) on the x-axis. The graph shows Jenny's heart rate from 0 to 20 minutes. From 0-5 minutes, she was resting on a chair (labeled P). From 5-10 minutes, she carried out activity Q. From 10-15 minutes, she carried out activity R. The graph shows a line for P (roughly horizontal at around 70 bpm), followed by Q (slight decrease), then R (increase to around 100 bpm at the 15-minute mark). The section from 15-20 minutes needs to be completed. Vertical dashed lines mark the boundaries at 5, 10, 15, and 20 minutes.
1 mark
P6_Science_Prelim_2022_Raffles_Exam_Papers 2022
Q26

State the main organ system responsible for the changes in the volume of blood supplied per minute during an exercise.
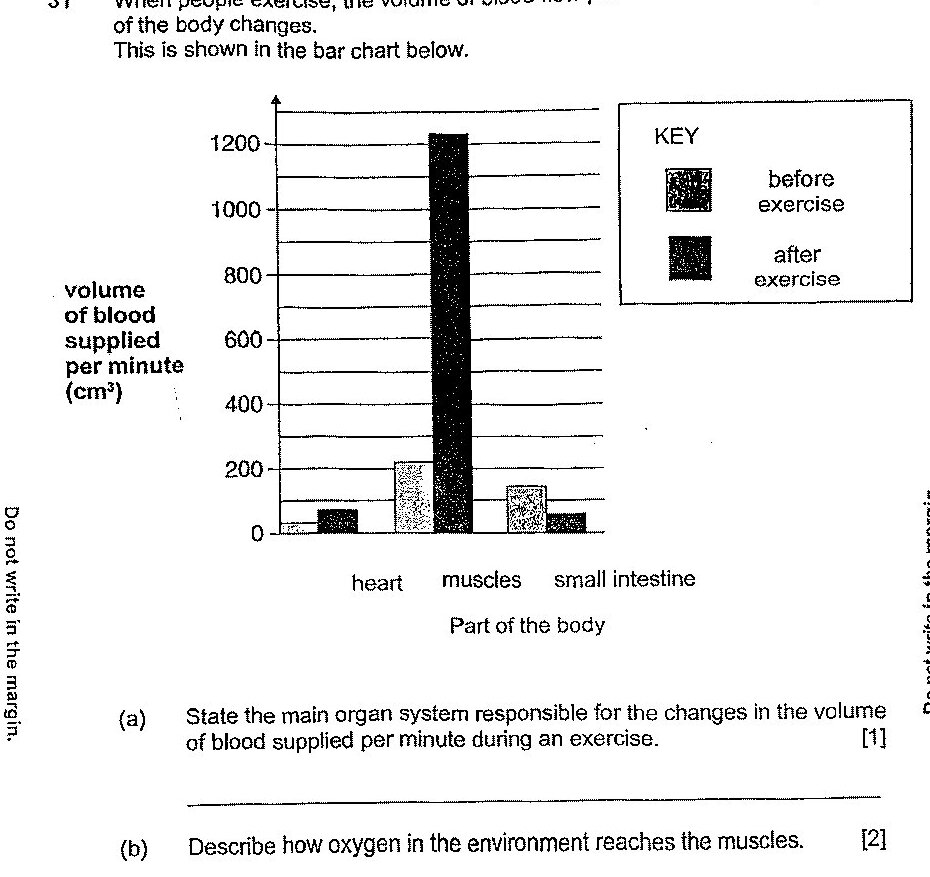
Bar chart showing volume of blood supplied per minute (cm³) to three parts of the body (heart, muscles, small intestine) before and after exercise. The heart shows approximately 50 cm³ before exercise and 100 cm³ after. Muscles show approximately 200 cm³ before exercise and 1200 cm³ after. Small intestine shows approximately 150 cm³ before exercise and 50 cm³ after exercise.
📊 Diagram: Bar chart showing volume of blood supplied per minute (cm³) to three parts of the body (heart, muscles, small intestine) before and after exercise. The heart shows approximately 50 cm³ before exercise and 100 cm³ after. Muscles show approximately 200 cm³ before exercise and 1200 cm³ after. Small intestine shows approximately 150 cm³ before exercise and 50 cm³ after exercise.
1 mark
P6_Science_Prelim_2022_Rosyth_Exam_Papers 2022
Q27

The diagram below shows the direction of blood flow in the blood vessels W, X, Y and Z, in Jatin's body. Which graph below shows the amount of carbon dioxide present in the blood flow at W and X?
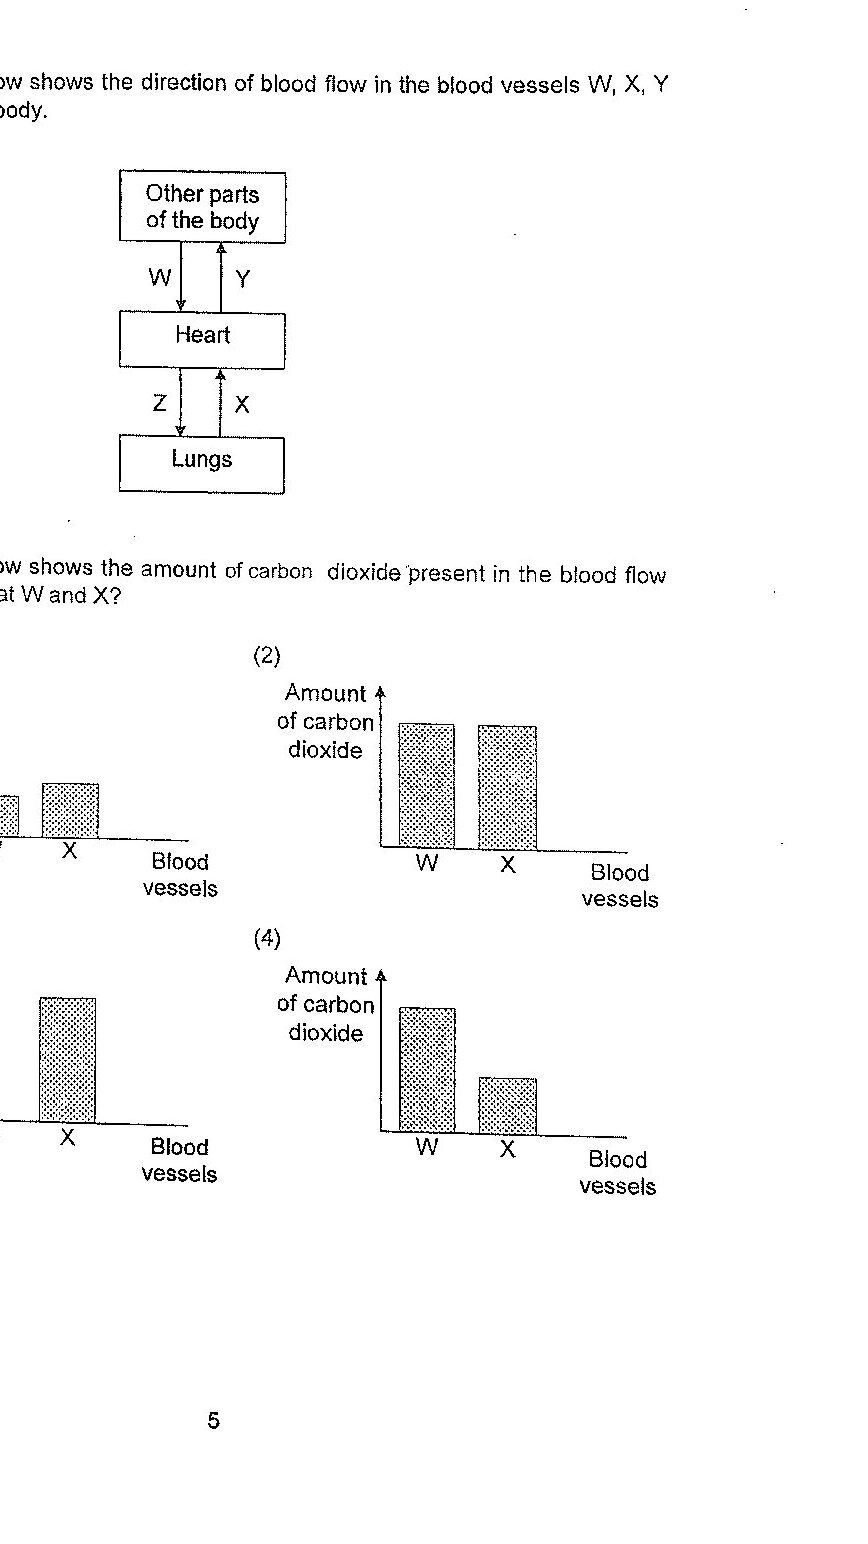
A flow diagram showing the direction of blood flow between body parts and organs. At the top is 'Other parts of the body' box. Below that is the 'Heart' box. At the bottom is the 'Lungs' box. Arrows show: W pointing downward from 'Other parts of the body' to 'Heart', Y pointing upward from 'Heart' to 'Other parts of the body', Z pointing downward from 'Heart' to 'Lungs', and X pointing upward from 'Lungs' to 'Heart'. Below this are four bar graphs labeled (1), (2), (3), and (4), each showing 'Amount of carbon dioxide' on the y-axis and 'Blood vessels' (W and X) on the x-axis. Graph (1) shows W with a moderate bar and X with a slightly higher bar. Graph (2) shows W and X with approximately equal high bars. Graph (3) shows W with no bar and X with a high bar. Graph (4) shows W with a high bar and X with a lower bar.
📊 Diagram: A flow diagram showing the direction of blood flow between body parts and organs. At the top is 'Other parts of the body' box. Below that is the 'Heart' box. At the bottom is the 'Lungs' box. Arrows show: W pointing downward from 'Other parts of the body' to 'Heart', Y pointing upward from 'Heart' to 'Other parts of the body', Z pointing downward from 'Heart' to 'Lungs', and X pointing upward from 'Lungs' to 'Heart'. Below this are four bar graphs labeled (1), (2), (3), and (4), each showing 'Amount of carbon dioxide' on the y-axis and 'Blood vessels' (W and X) on the x-axis. Graph (1) shows W with a moderate bar and X with a slightly higher bar. Graph (2) shows W and X with approximately equal high bars. Graph (3) shows W with no bar and X with a high bar. Graph (4) shows W with a high bar and X with a lower bar.
A.
B.
C.
D.
P6_Science_Prelim_2022_TaoNan_Exam_Papers 2022
Q28

Explain how the increase in his heart rate helps Mr Tan to survive.
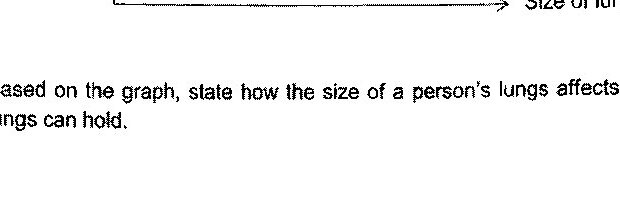
Diagram for question 33c
1 mark
P6_Science_2023_SA2_-_Maris_Stella_High 2023
Q29

Blood vessel D contains a greater amount of dissolved gas Y than blood vessel C. Identify gas Y.
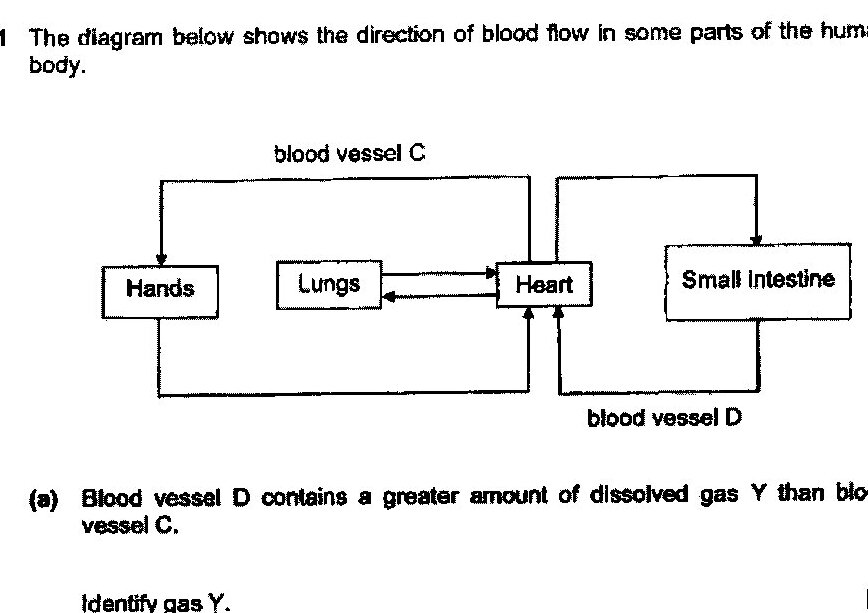
A diagram showing the direction of blood flow in parts of the human body. It shows: Blood vessel C flowing from the top into Hands and Lungs. The Heart is connected to both Lungs and Small Intestine. Blood vessel D flows from the Heart to the Small Intestine and returns from the Hands back to the Heart. Arrows indicate the direction of blood flow throughout the system.
📊 Diagram: A diagram showing the direction of blood flow in parts of the human body. It shows: Blood vessel C flowing from the top into Hands and Lungs. The Heart is connected to both Lungs and Small Intestine. Blood vessel D flows from the Heart to the Small Intestine and returns from the Hands back to the Heart. Arrows indicate the direction of blood flow throughout the system.
1 mark
P6_Science_2023_SA2_-_Nan_Hua 2023
Q30

Using the diagram above, describe how muscle cells in the hands receive oxygen and digested food to perform its daily function.
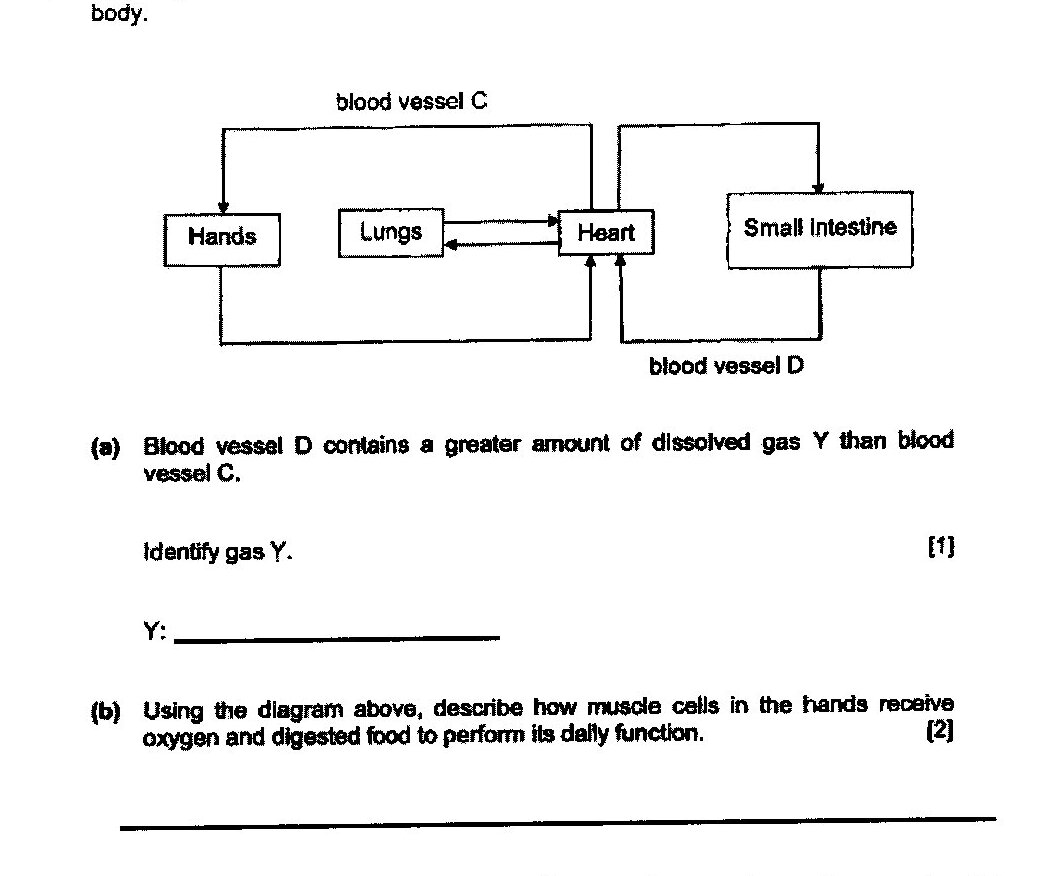
A diagram showing the direction of blood flow in parts of the human body. It shows: Blood vessel C flowing from the top into Hands and Lungs. The Heart is connected to both Lungs and Small Intestine. Blood vessel D flows from the Heart to the Small Intestine and returns from the Hands back to the Heart. Arrows indicate the direction of blood flow throughout the system.
📊 Diagram: A diagram showing the direction of blood flow in parts of the human body. It shows: Blood vessel C flowing from the top into Hands and Lungs. The Heart is connected to both Lungs and Small Intestine. Blood vessel D flows from the Heart to the Small Intestine and returns from the Hands back to the Heart. Arrows indicate the direction of blood flow throughout the system.
2 marks
P6_Science_2023_SA2_-_Nan_Hua 2023

Past year papers cover the full exam — browse by subject below.

View All Papers ›